Introducing GravityCharts by GravityView

Written by Zack Katz from GravityView…
GravityCharts is the latest addition to GravityView’s suite of essential Gravity Forms Add-Ons.
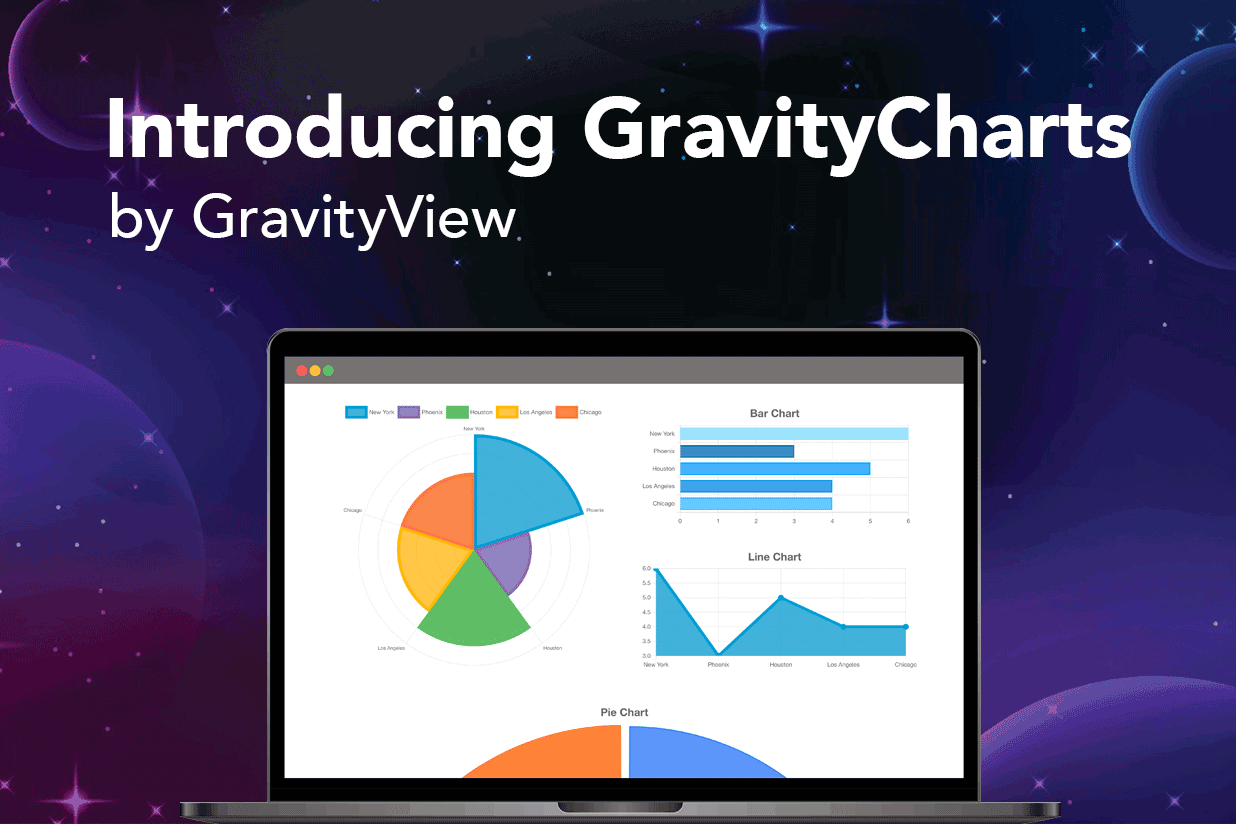
GravityCharts allows you to create beautiful, custom charts and graphs using your form data. There are 5 chart types to choose from, and a range of customization options, allowing you to create attractive visualizations without writing any code.
Keep reading to find out how you can use GravityCharts to build powerful dashboards and create business reports using a modern, intuitive and accessible user interface.
GravityCharts Feature Highlights
GravityCharts allows you to plot your Gravity Forms data on a chart using one of five available chart types. Simply create a new chart feed, select a data source and customize the design to your liking.
Here are some stand out features that will make you fall in love with GravityCharts:
- Extensive design options – Select a color palette, adjust the line thickness, add a legend, and much more.
- Intuitive and accessible user interface – As you tweak aspects of the design, the chart preview will update in real-time to reflect your changes. This allows you to create the perfect chart before adding it to a live page on your site.
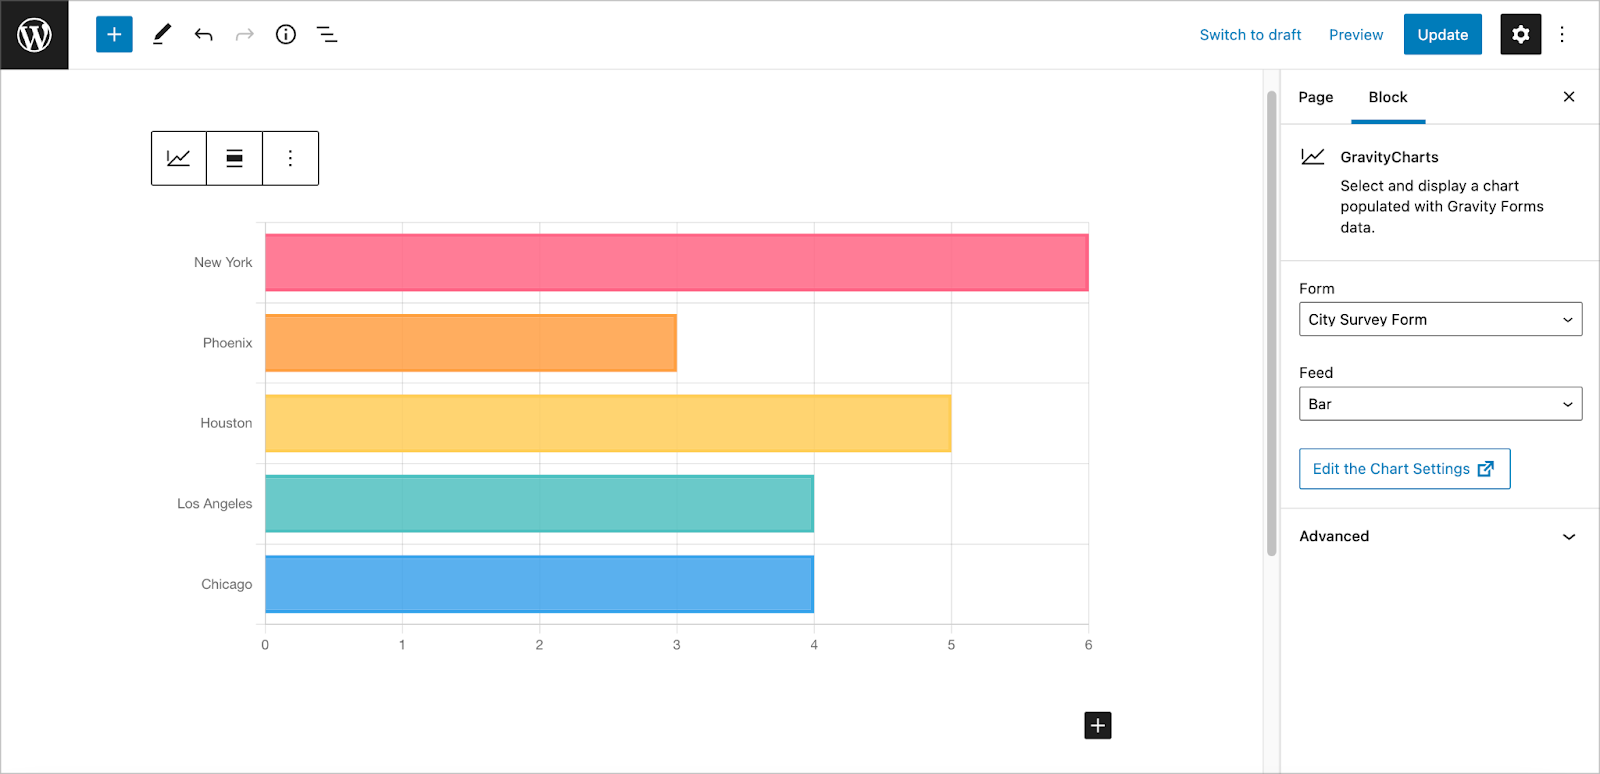
- Embed using a block – Easily embed your charts using the GravityCharts Gutenberg block.
With GravityCharts, you can impress your clients with modern-looking charts that update as you receive new entries. Get ready to create analytics reports, dashboards, and beautiful data visualizations!
Getting Started With GravityCharts
GravityCharts is available to purchase on the GravityView website. If you’re already a GravityView All Access customer, you can install GravityCharts at no additional cost!
After installing and activating the plugin, head over to your Form Settings page, select the GravityCharts tab on the left, and then click Add New to create a new chart feed. (You can create an unlimited number of charts per form!)
Creating a New Chart
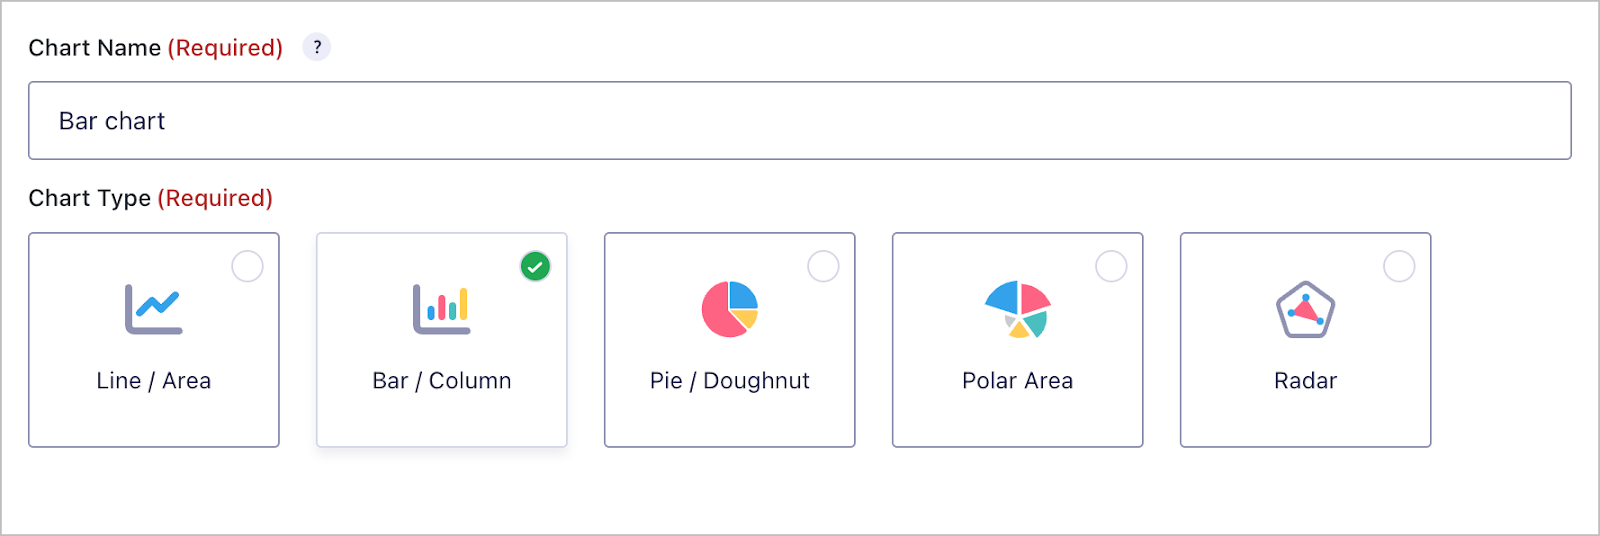
After creating a new feed, give your chart a name, choose one of the five available chart types and select a data source.
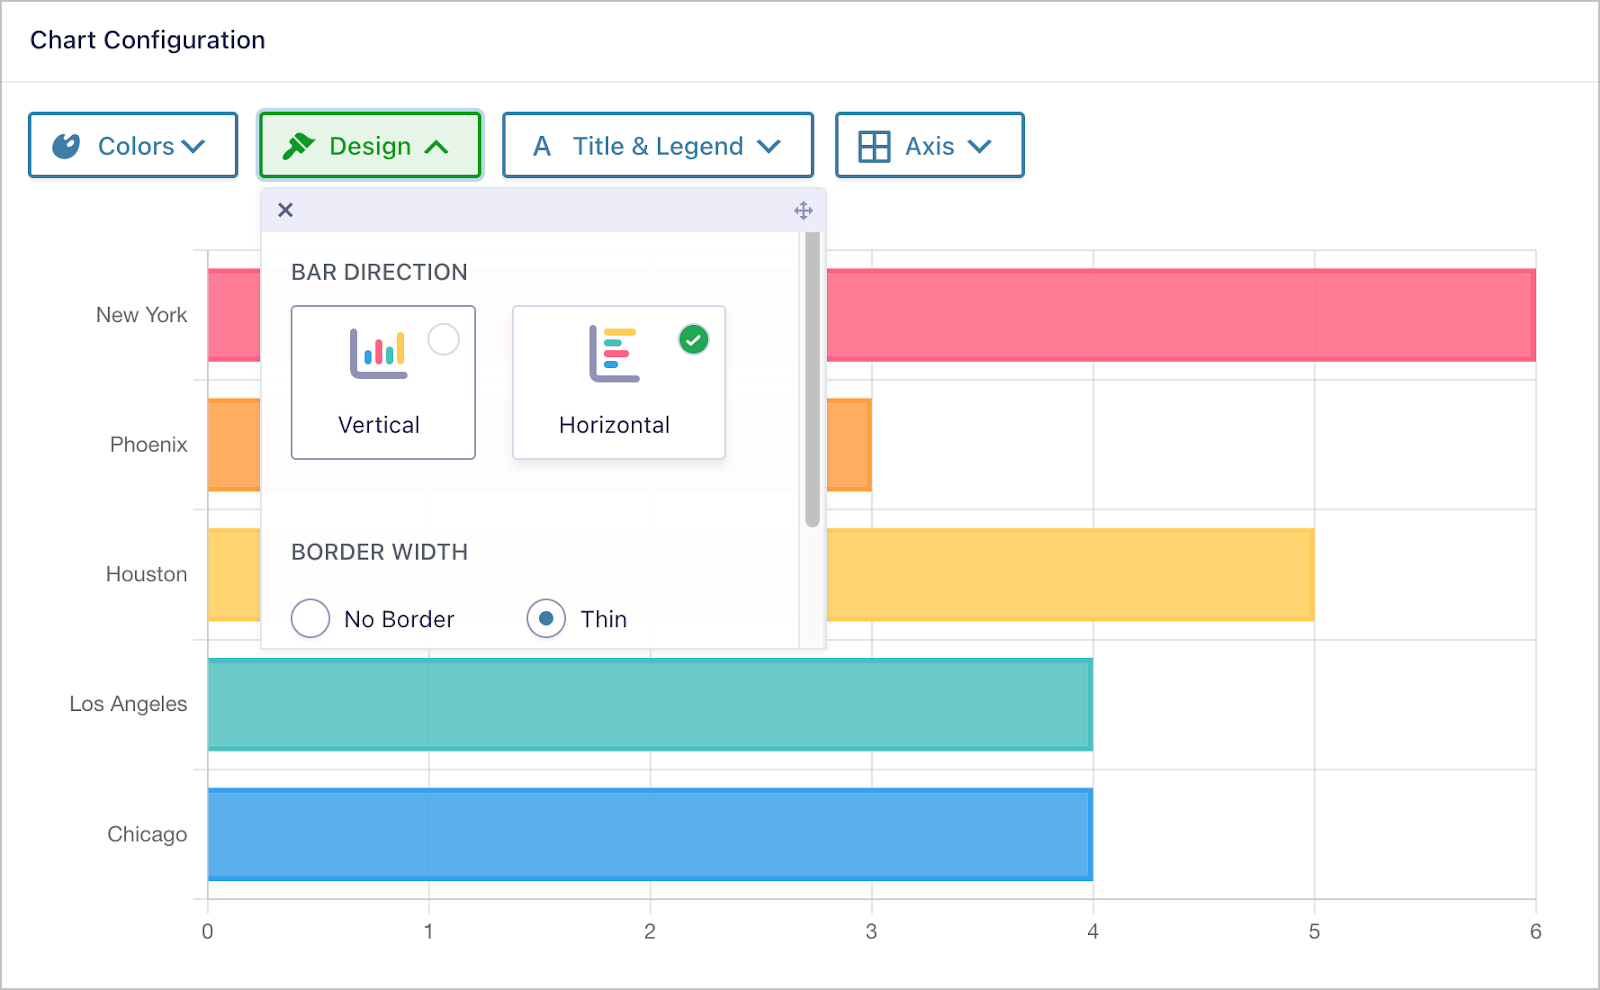
When you’ve done that, scroll down to the chart configuration panel. Here, you can customize the chart design while viewing a preview of your chart that updates in real-time!
Customizing the Design
Above the chart preview, there are four design tabs – Colors, Design, Title & Legend, and Axis. Each tab includes a range of options for customizing the look and feel of your chart.
When you open a tab, you can drag it around and position it where you like on the screen.
As you make changes to your chart’s design, you’ll see the chart preview update in real-time. This allows you to design beautiful visualizations in seconds without writing a single line of code.
Embedding Your Chart on a Page or Post
After configuring the chart design, scroll down and save your changes. You can now embed your chart on a page or post!
To do this, open your page/post, click on the ‘+’ icon and search for the GravityCharts block. After adding the block to your page, you’ll need to select your form and chart feed from the dropdown menus.
When you’re done, simply update the page and view it on the front end. Your chart will update as you receive new form entries!
Start Creating Beautiful Visualizations With GravityCharts
With GravityCharts, you can create beautiful visualizations using your form data, build powerful dashboards and learn more about your customers.
GravityCharts is now available to purchase from GravityView’s website as either a standalone plugin or as part of their All Access license. If you have any questions about GravityCharts, check out the plugin FAQ section or reach out to GravityView’s Support team!


