How to Turn Your Form Entries into Dashboards With GravityKit
Written by the Editorial team at GravityKit…
You’ve done the hard work – your forms are live, data is pouring in, and Gravity Forms is doing what it does best: collecting information. But now comes the tricky part… What do you do with all that data?
Export it to Excel? Manually compile reports? Spend hours creating charts in third-party tools?
There’s a better option. Leverage the data management capabilities of Gravity Forms together with the powerful display options and reporting tools offered by GravityKit and transform your form entries into fully interactive dashboards – no code required.
Turn Your Form Entries Into Dashboards
Very often, important data remains stuck in silos, making it difficult to share and analyze. This can lead to bottlenecks, impeding business growth and reducing efficiency. Dashboards help liberate your data for more effective visualization and analysis.
Dashboards promote increased visibility for stakeholders and team members. Having a dashboard directly on your WordPress site also removes the need to build reports in Excel or other third-party tools, saving you time and effort.
So what tools does GravityKit provide to make this happen?
- GravityView – This app builder enables you to create dynamic, front-end displays for your data using drag and drop.
- GravityCharts – Create charts for visualizing your form data; see how metrics change over time or compare key data points.
- GravityMath – Perform advanced calculations on your data to track key metrics and data points.
Before we dive into some real-world examples, here is the basic process for building dashboards using Gravity Forms and GravityKit:
- Step 1: Create your form in Gravity Forms (or use an existing one).
- Step 2: Use GravityView to build a front end layout for the data.
- Step 3: Add charts to visualize data and track trends.
- Step 4: Add live calculations to stay on top of key metrics.
- Step 5: Configure filters, search fields, and user permissions.
- Step 6: Publish your dashboard for internal or public viewing.
Let’s take a look at some real-world examples related to nonprofits, small businesses, educational institutions and fitness platforms.
Nonprofit (Fundraising and Donations)
Gravity Forms supports a range of different payment gateways, providing nonprofits with an easy way to accept donations through their website. Using GravityKit, nonprofits can take things further by building dashboards to track donations and fundraising campaigns!
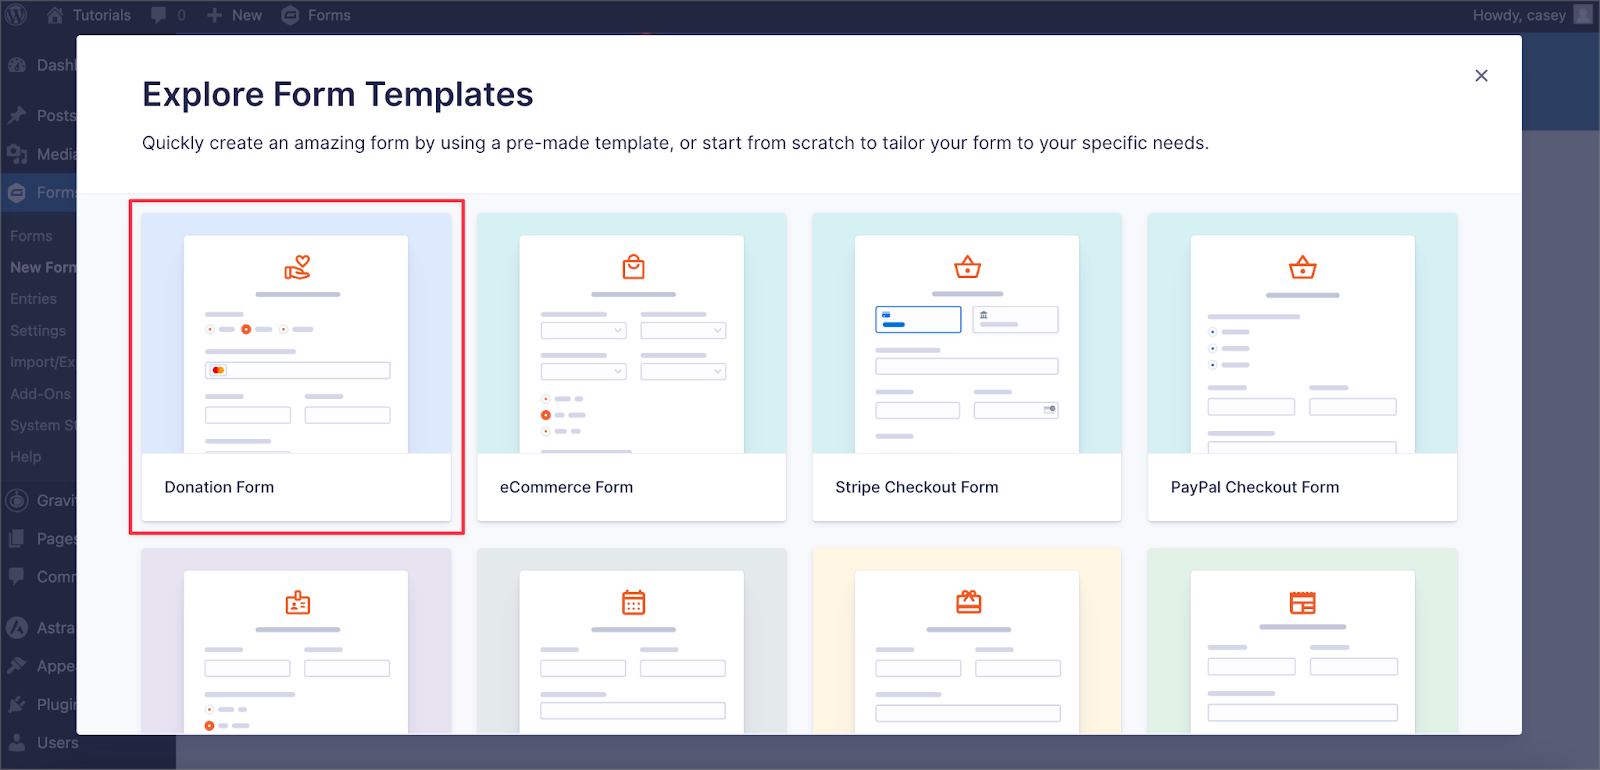
First, start by creating a new donation form. You can do this using the Gravity Forms donation form template.
Next, install one of the supported payment gateway add-ons (like PayPal or Stripe, for example). Now that you have a way to accept donations through your website, you can construct a dashboard to track your fundraising activities.
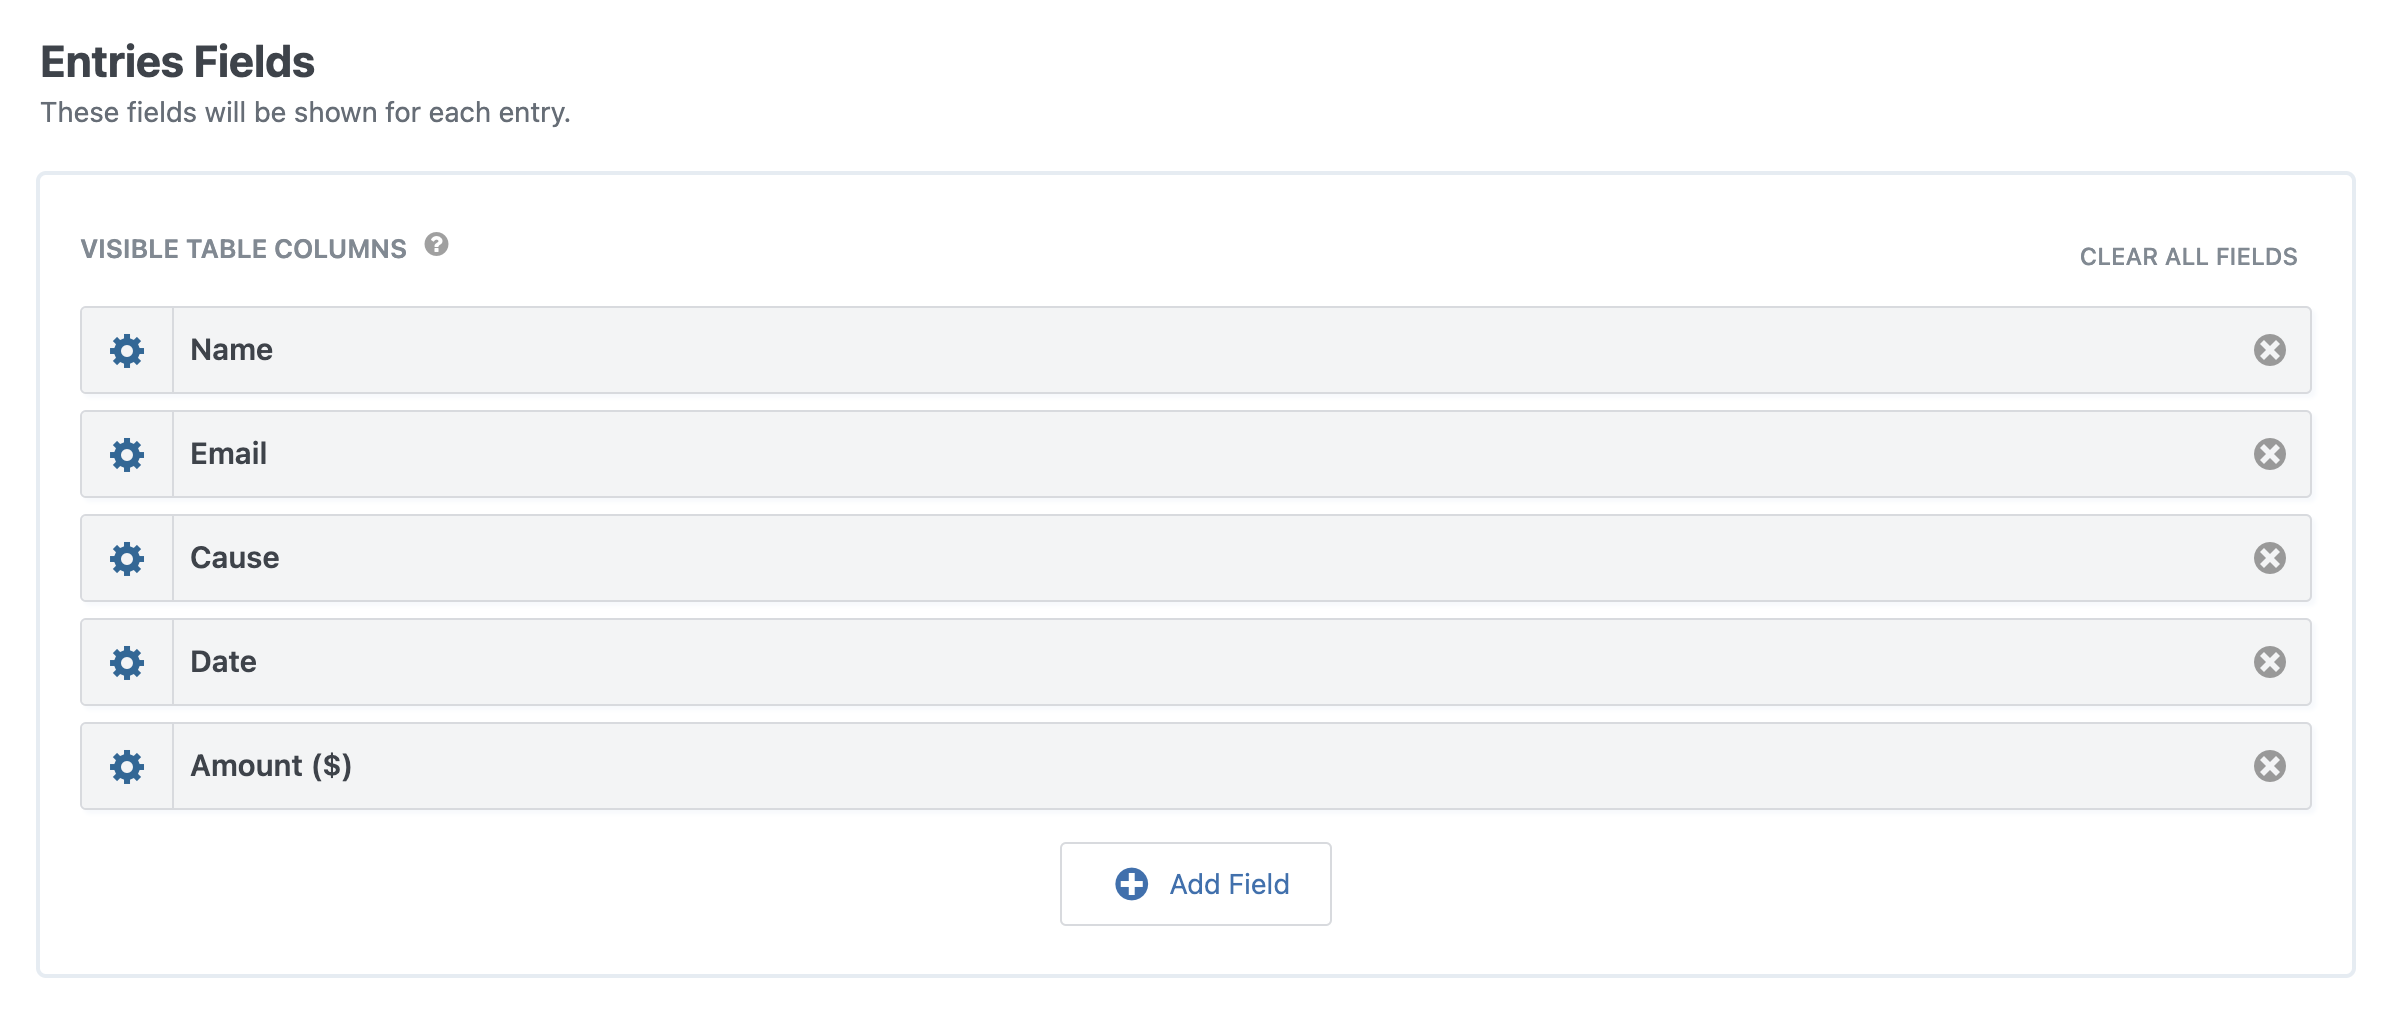
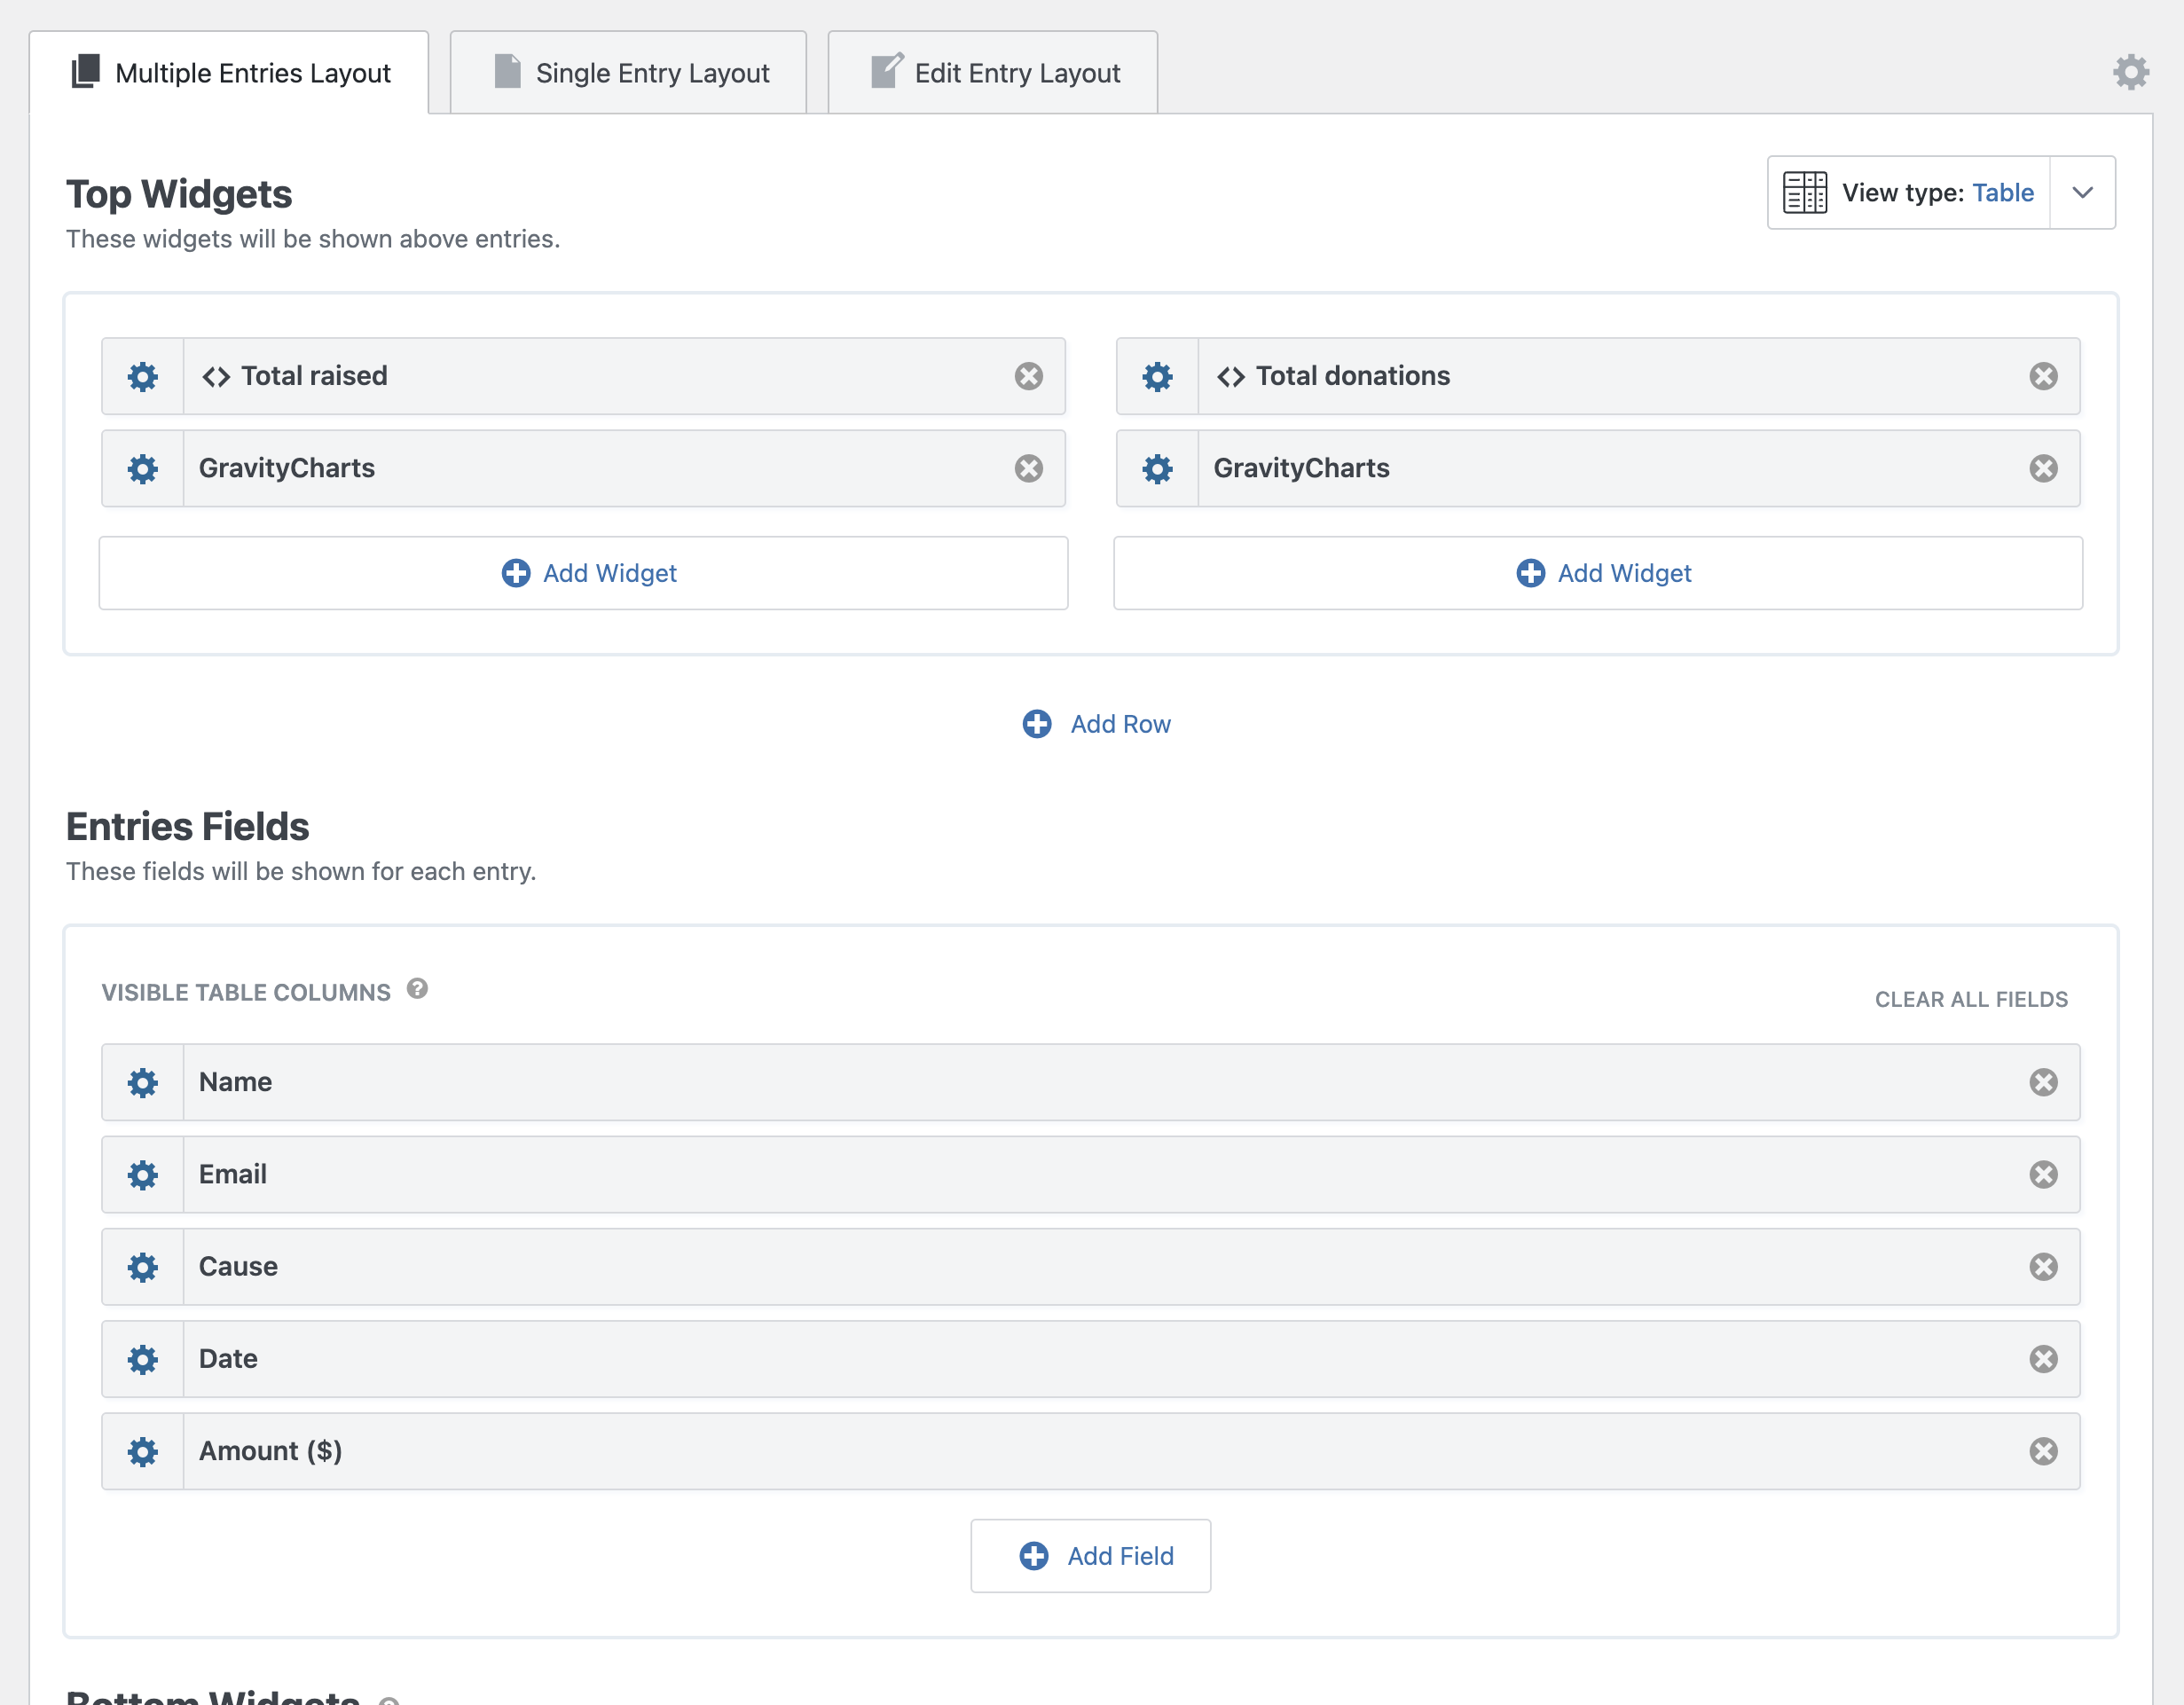
Start by setting up a new View using GravityView.A View is a customizable, visual interface for your form data that you can embed anywhere on your site. Start by selecting the Table layout to showcase donations in a table with rows and columns, and select the fields you want to display.
Next, use GravityChartsto create charts for visualizing donations over time and the amount raised over different time periods. Charts are added to Gravity Forms as feeds, so you can have multiple charts per form.
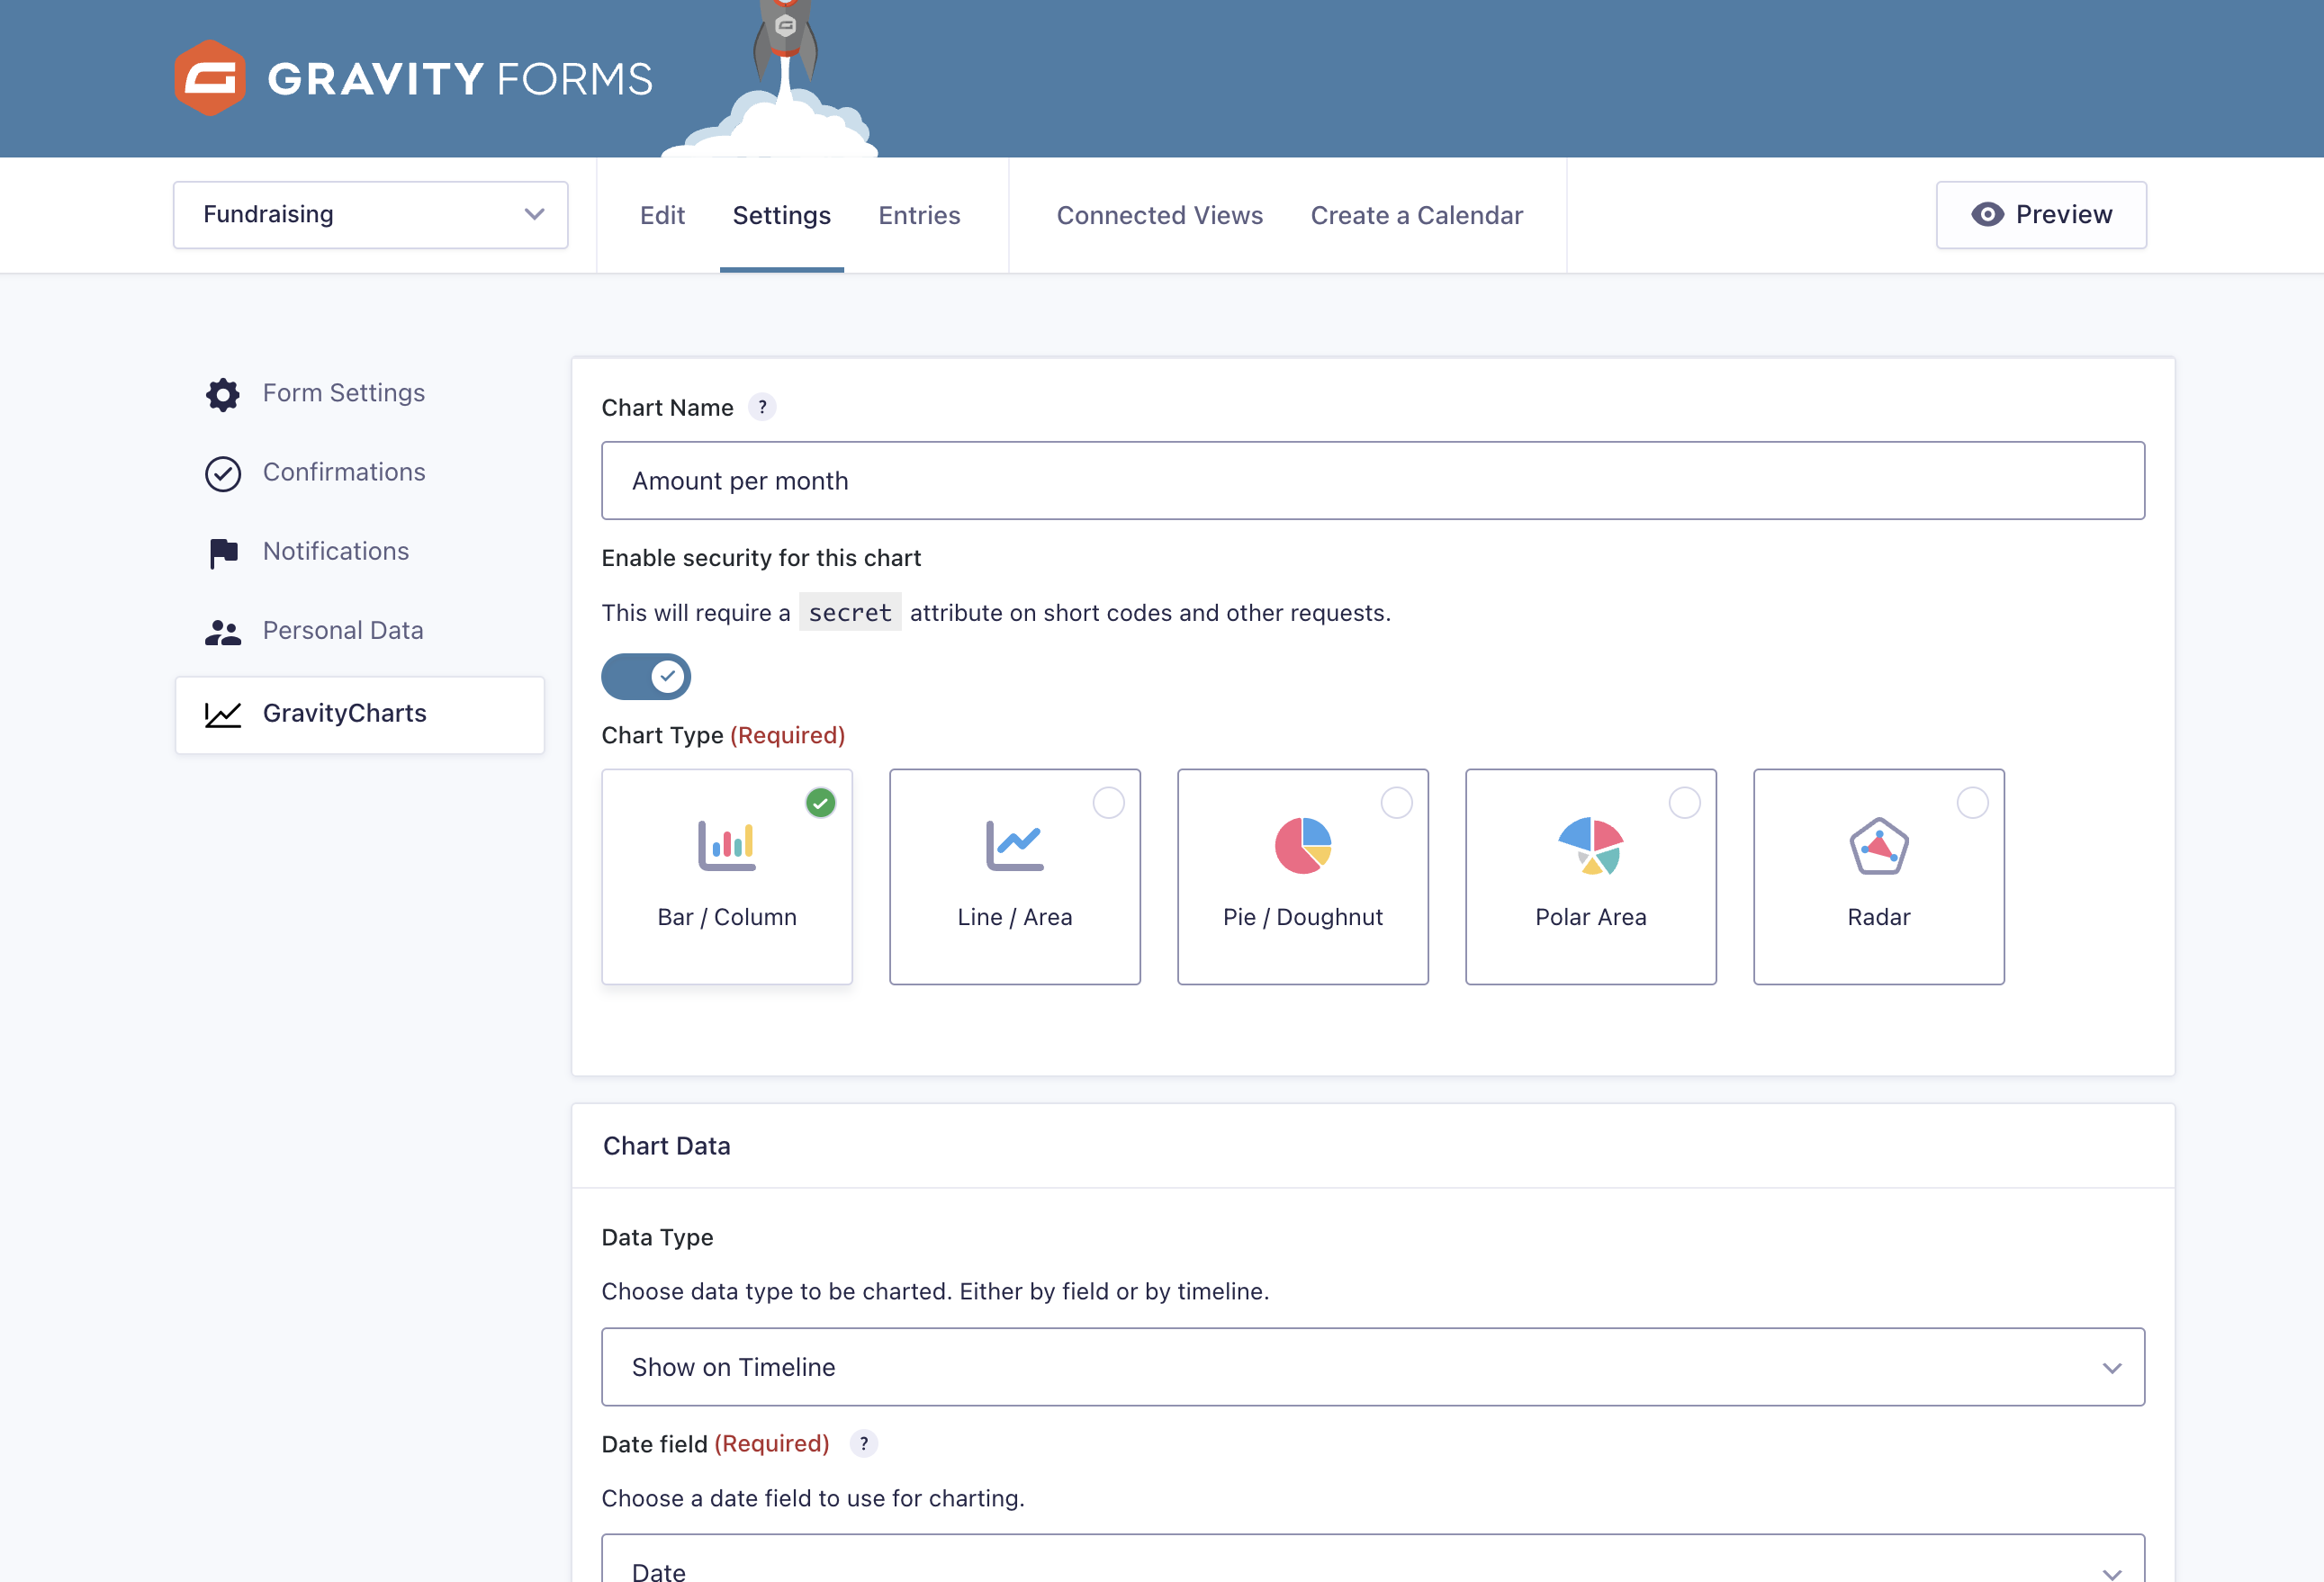
After configuring your charts, you can add them in your View as widgets.
The final piece of the puzzle is using GravityMath to calculate key metrics and summary statistics. GravityMath provides a handy shortcode for performing advanced calculations on your form data. You can use it to sum up all donation amounts and the total donations received.
Finally, add these calculations to your View by inserting the shortcode into a Custom Content widget. Here’s what the View editor looks like after adding all the widgets and fields.
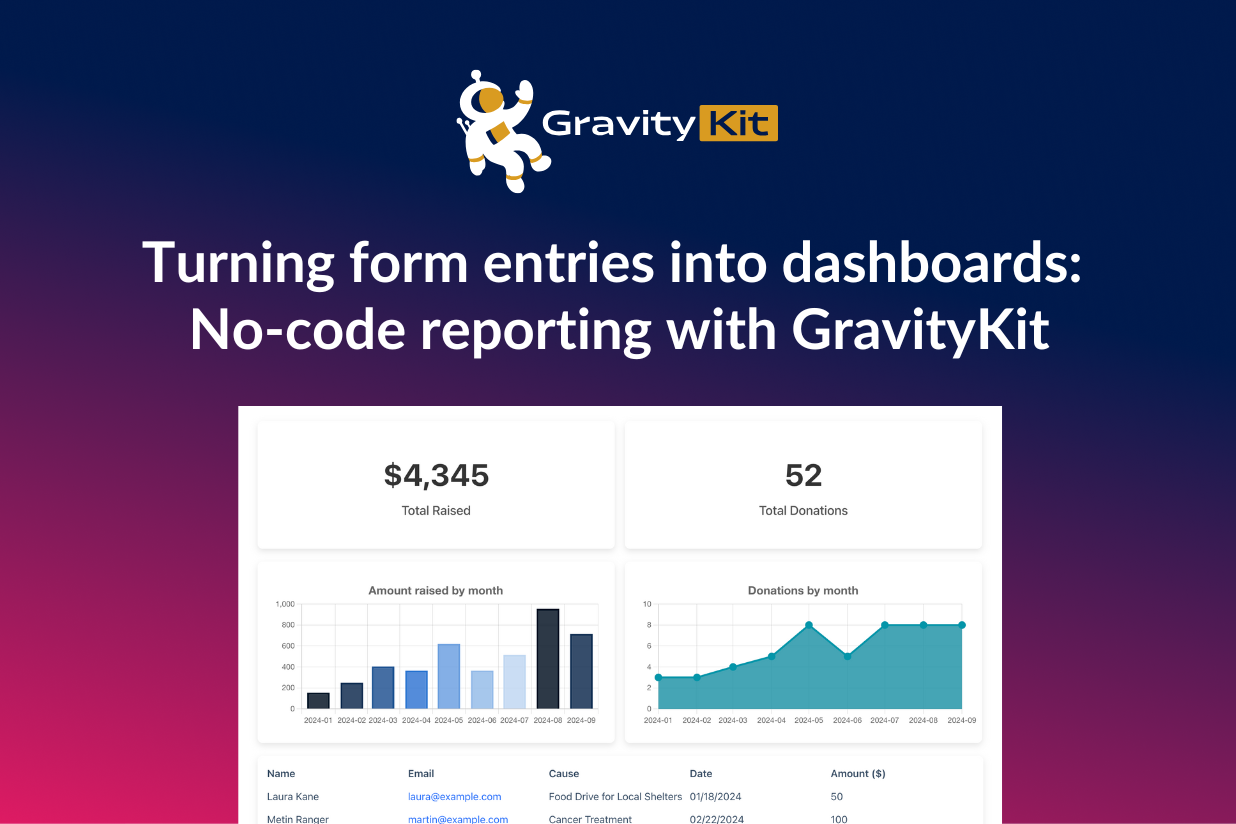
That’s it! Here’s what the completed dashboard looks like on the front end:
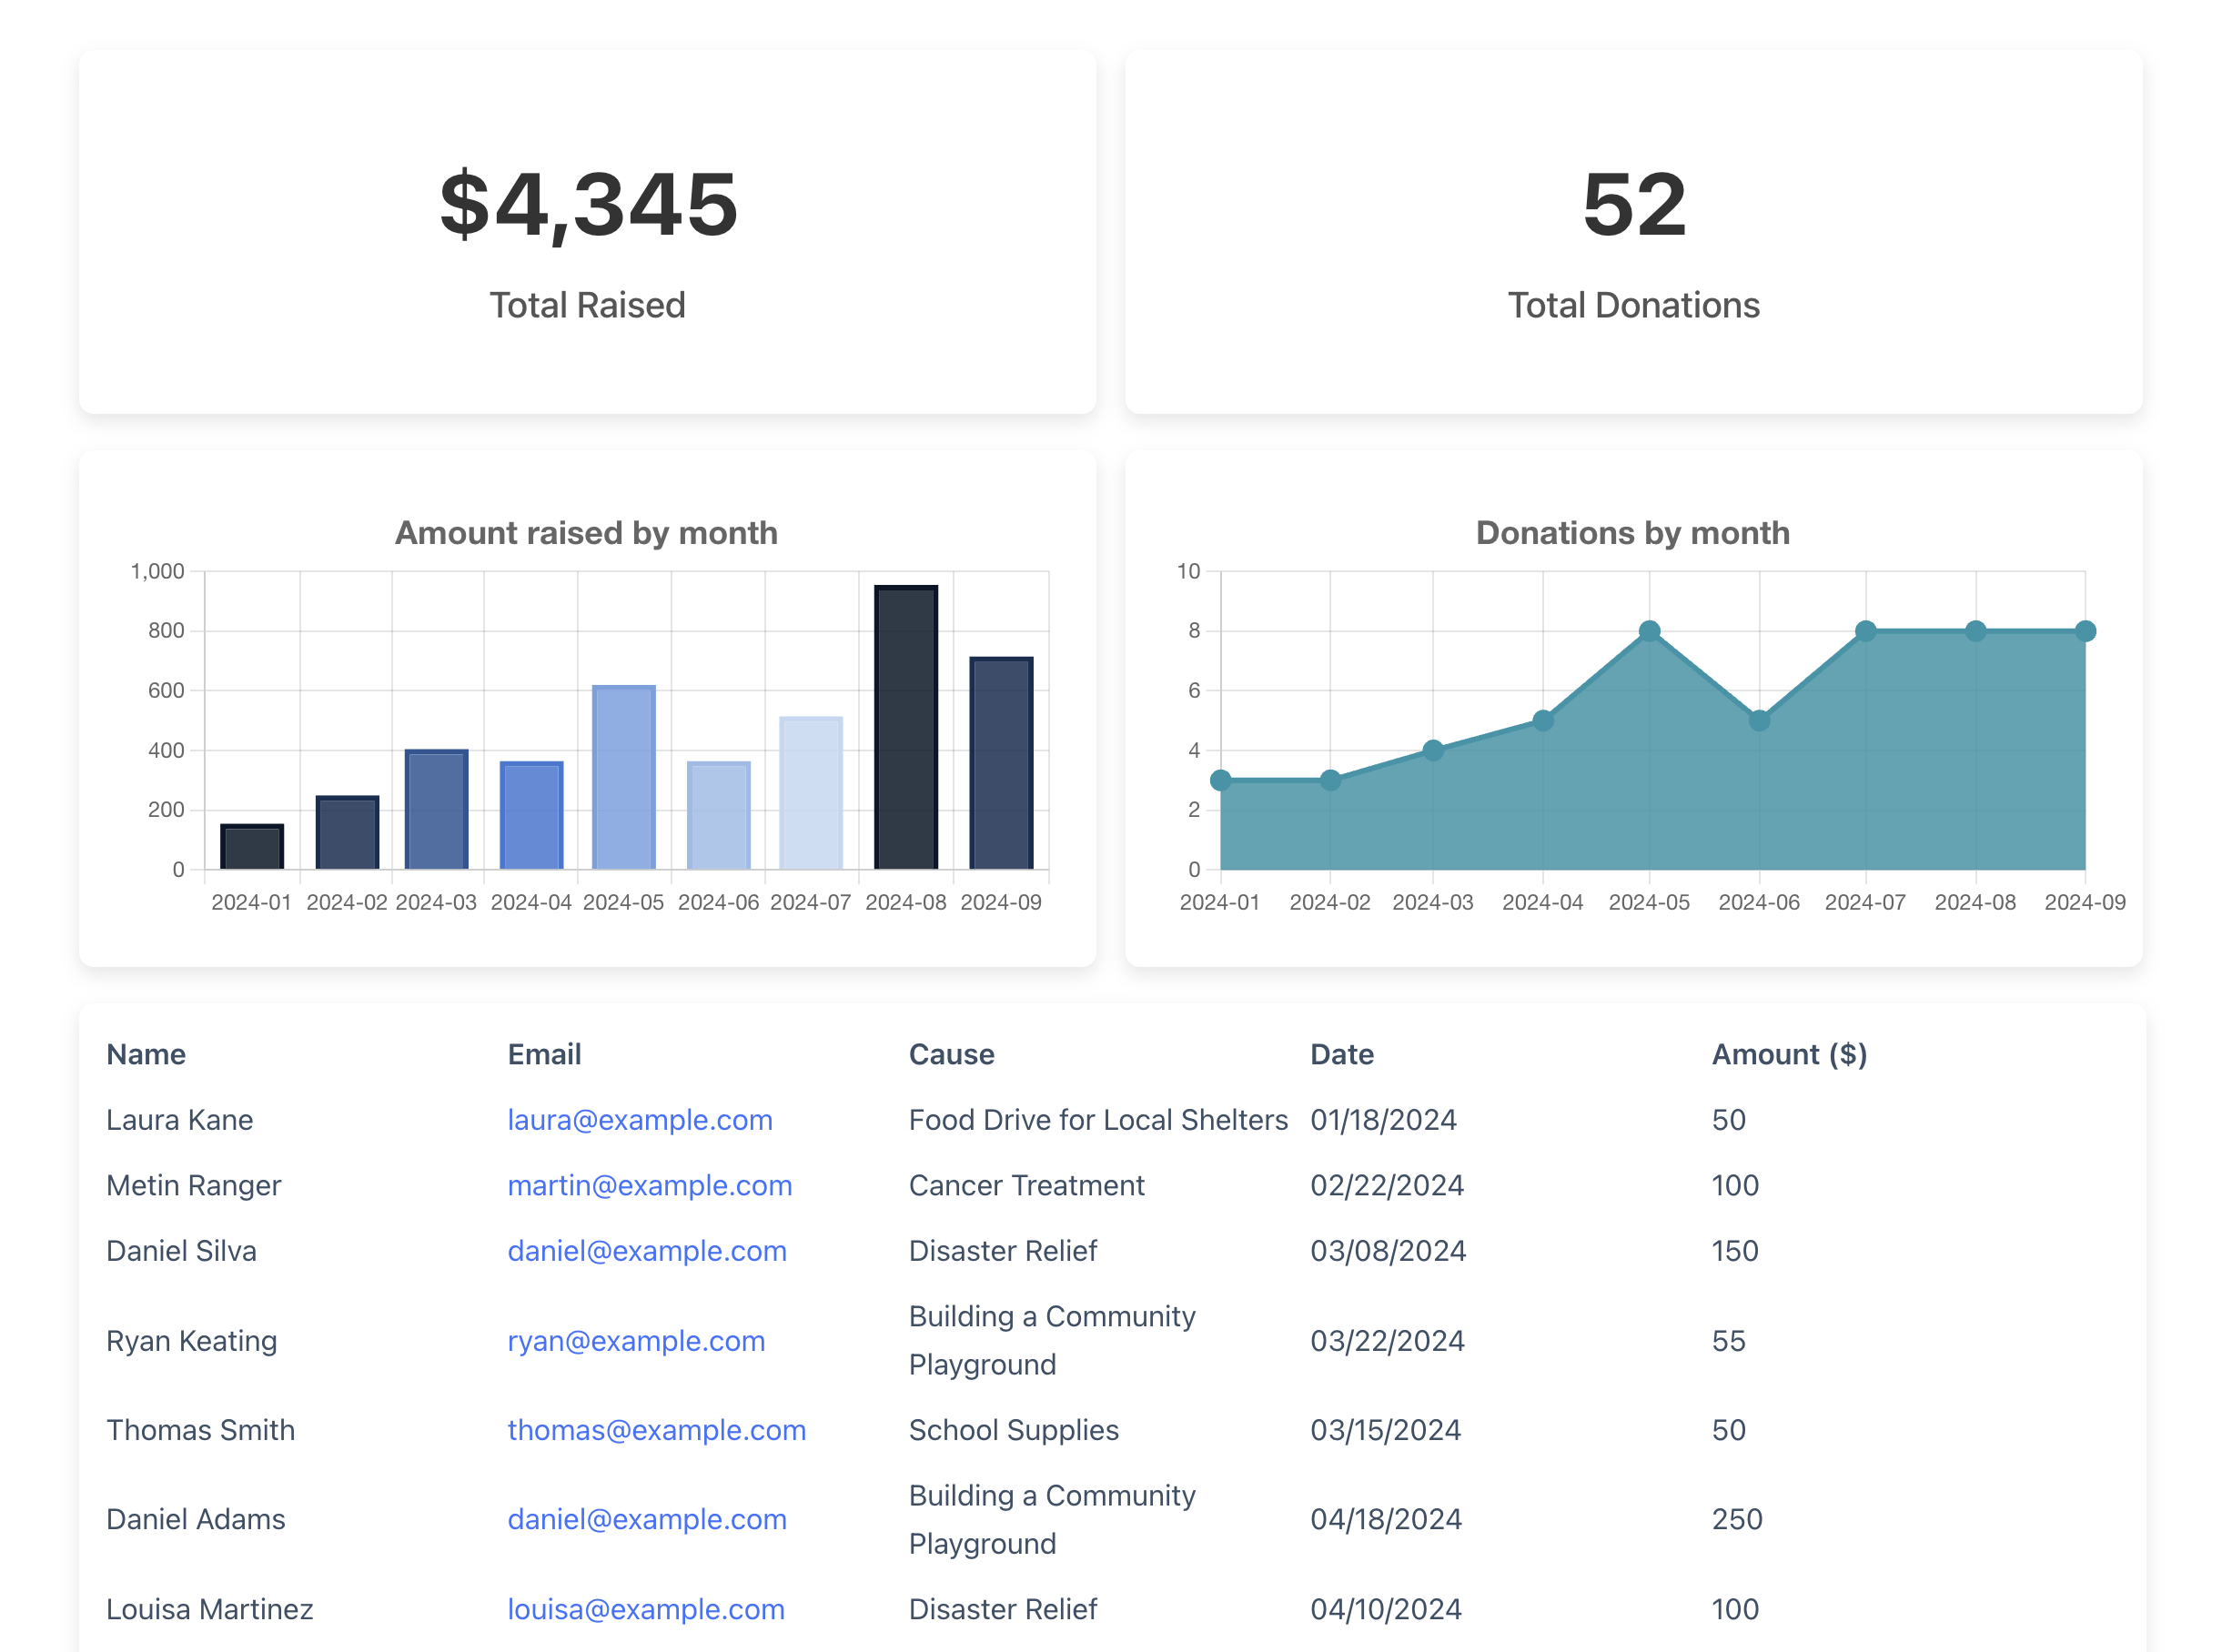
Want to learn more? Check out a live demo of the fundraising dashboard here.
Business (Expense Tracker)
In this next example, we’ll show you how to create a business dashboard for tracking expenses.
Start by creating a new form that enables team members to submit expense reports. Include a Number field for the amount spent, a Drop Down field for the expense category, a Single Line Text field for a short description of the expense and another Drop Down field for the status.
![]()
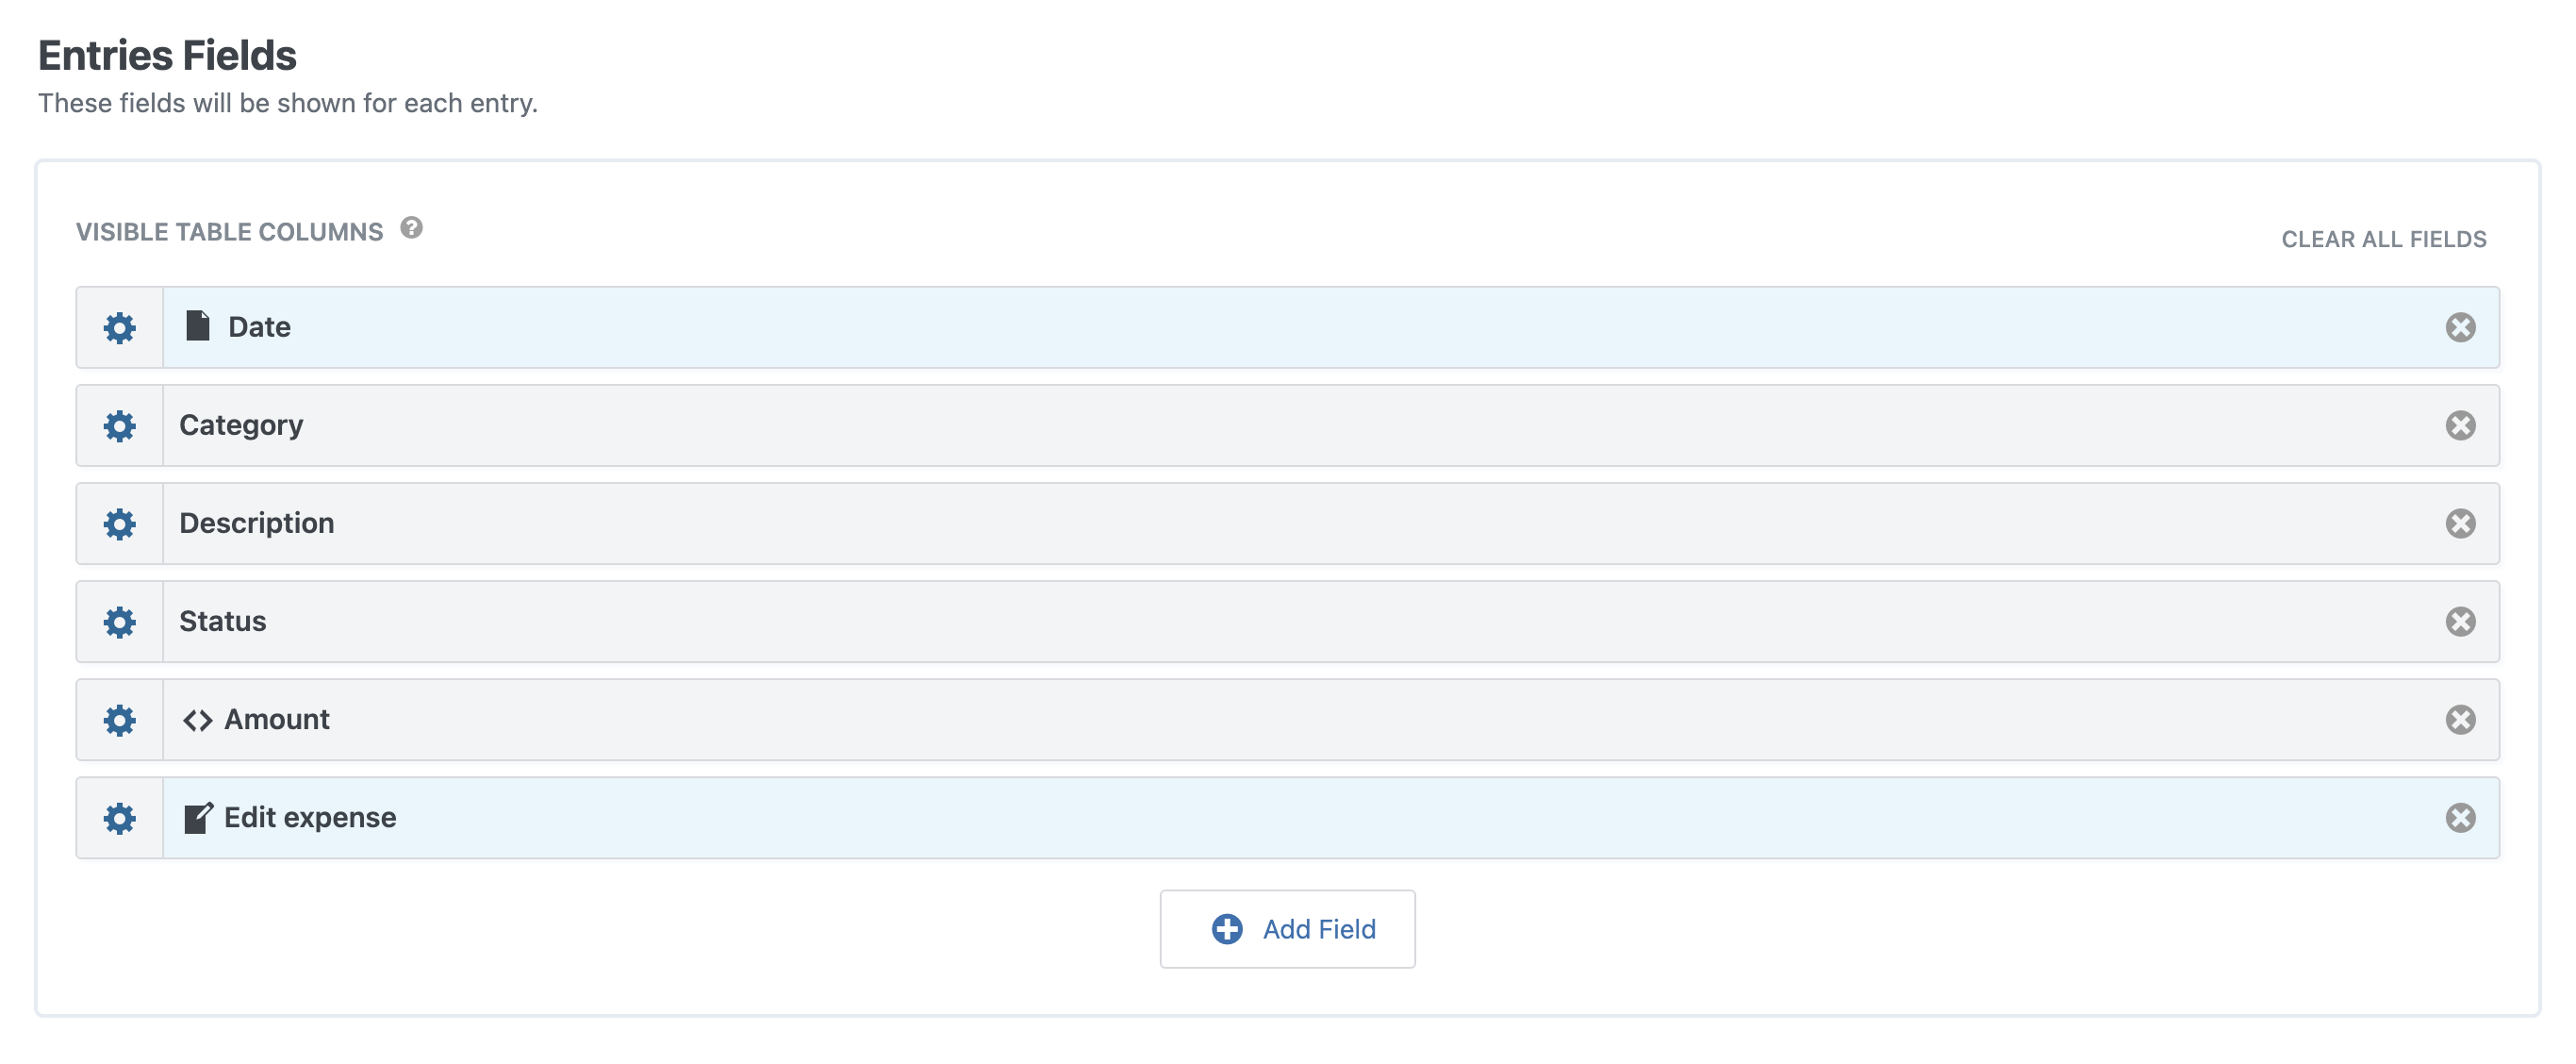
Next, create a new table View using GravityViewto group and display expenses. This makes it easy to see the date the expense occurred, the category, a short description and the amount spent.
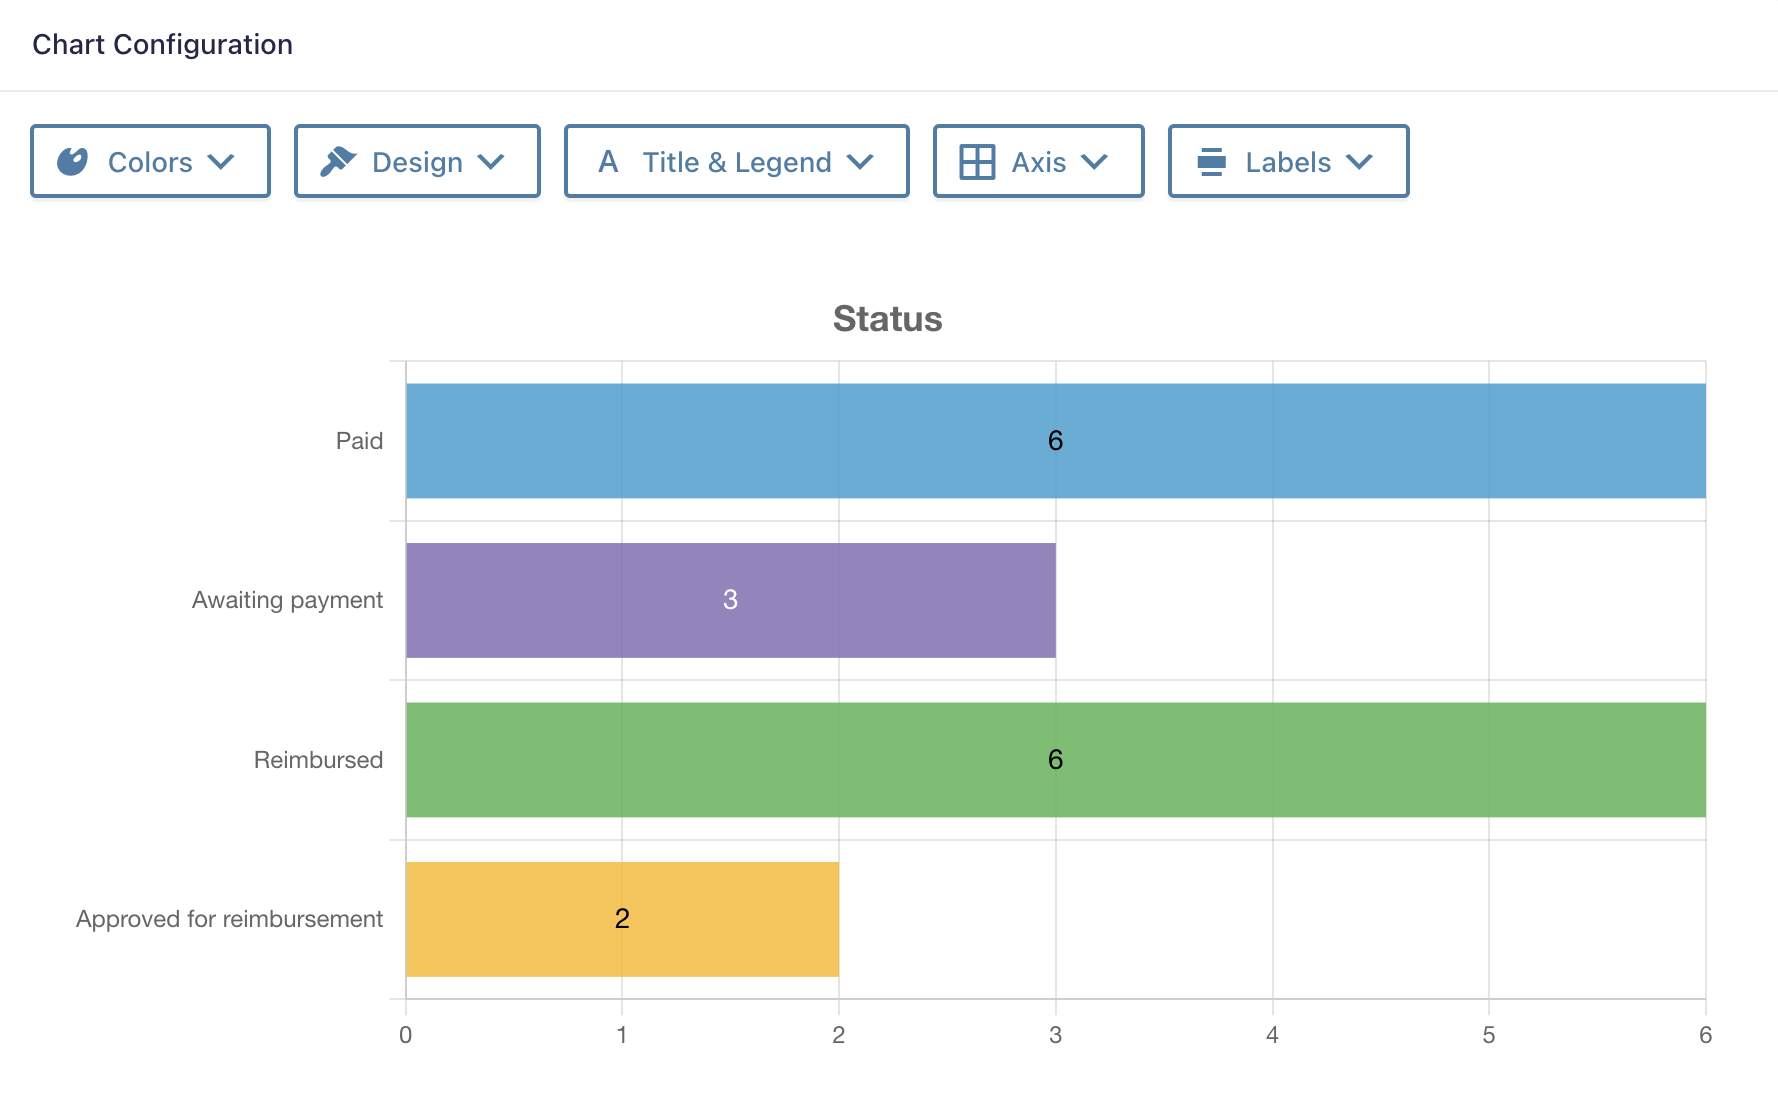
The next step is to configure the charts. Use GravityCharts to create a pie chart to visualize expenses by category, and a bar chart to show expenses by status.
After creating your charts, add them to your View using the GravityCharts widget. You can also add a search bar, enabling users to to filter expenses by date, status or category.
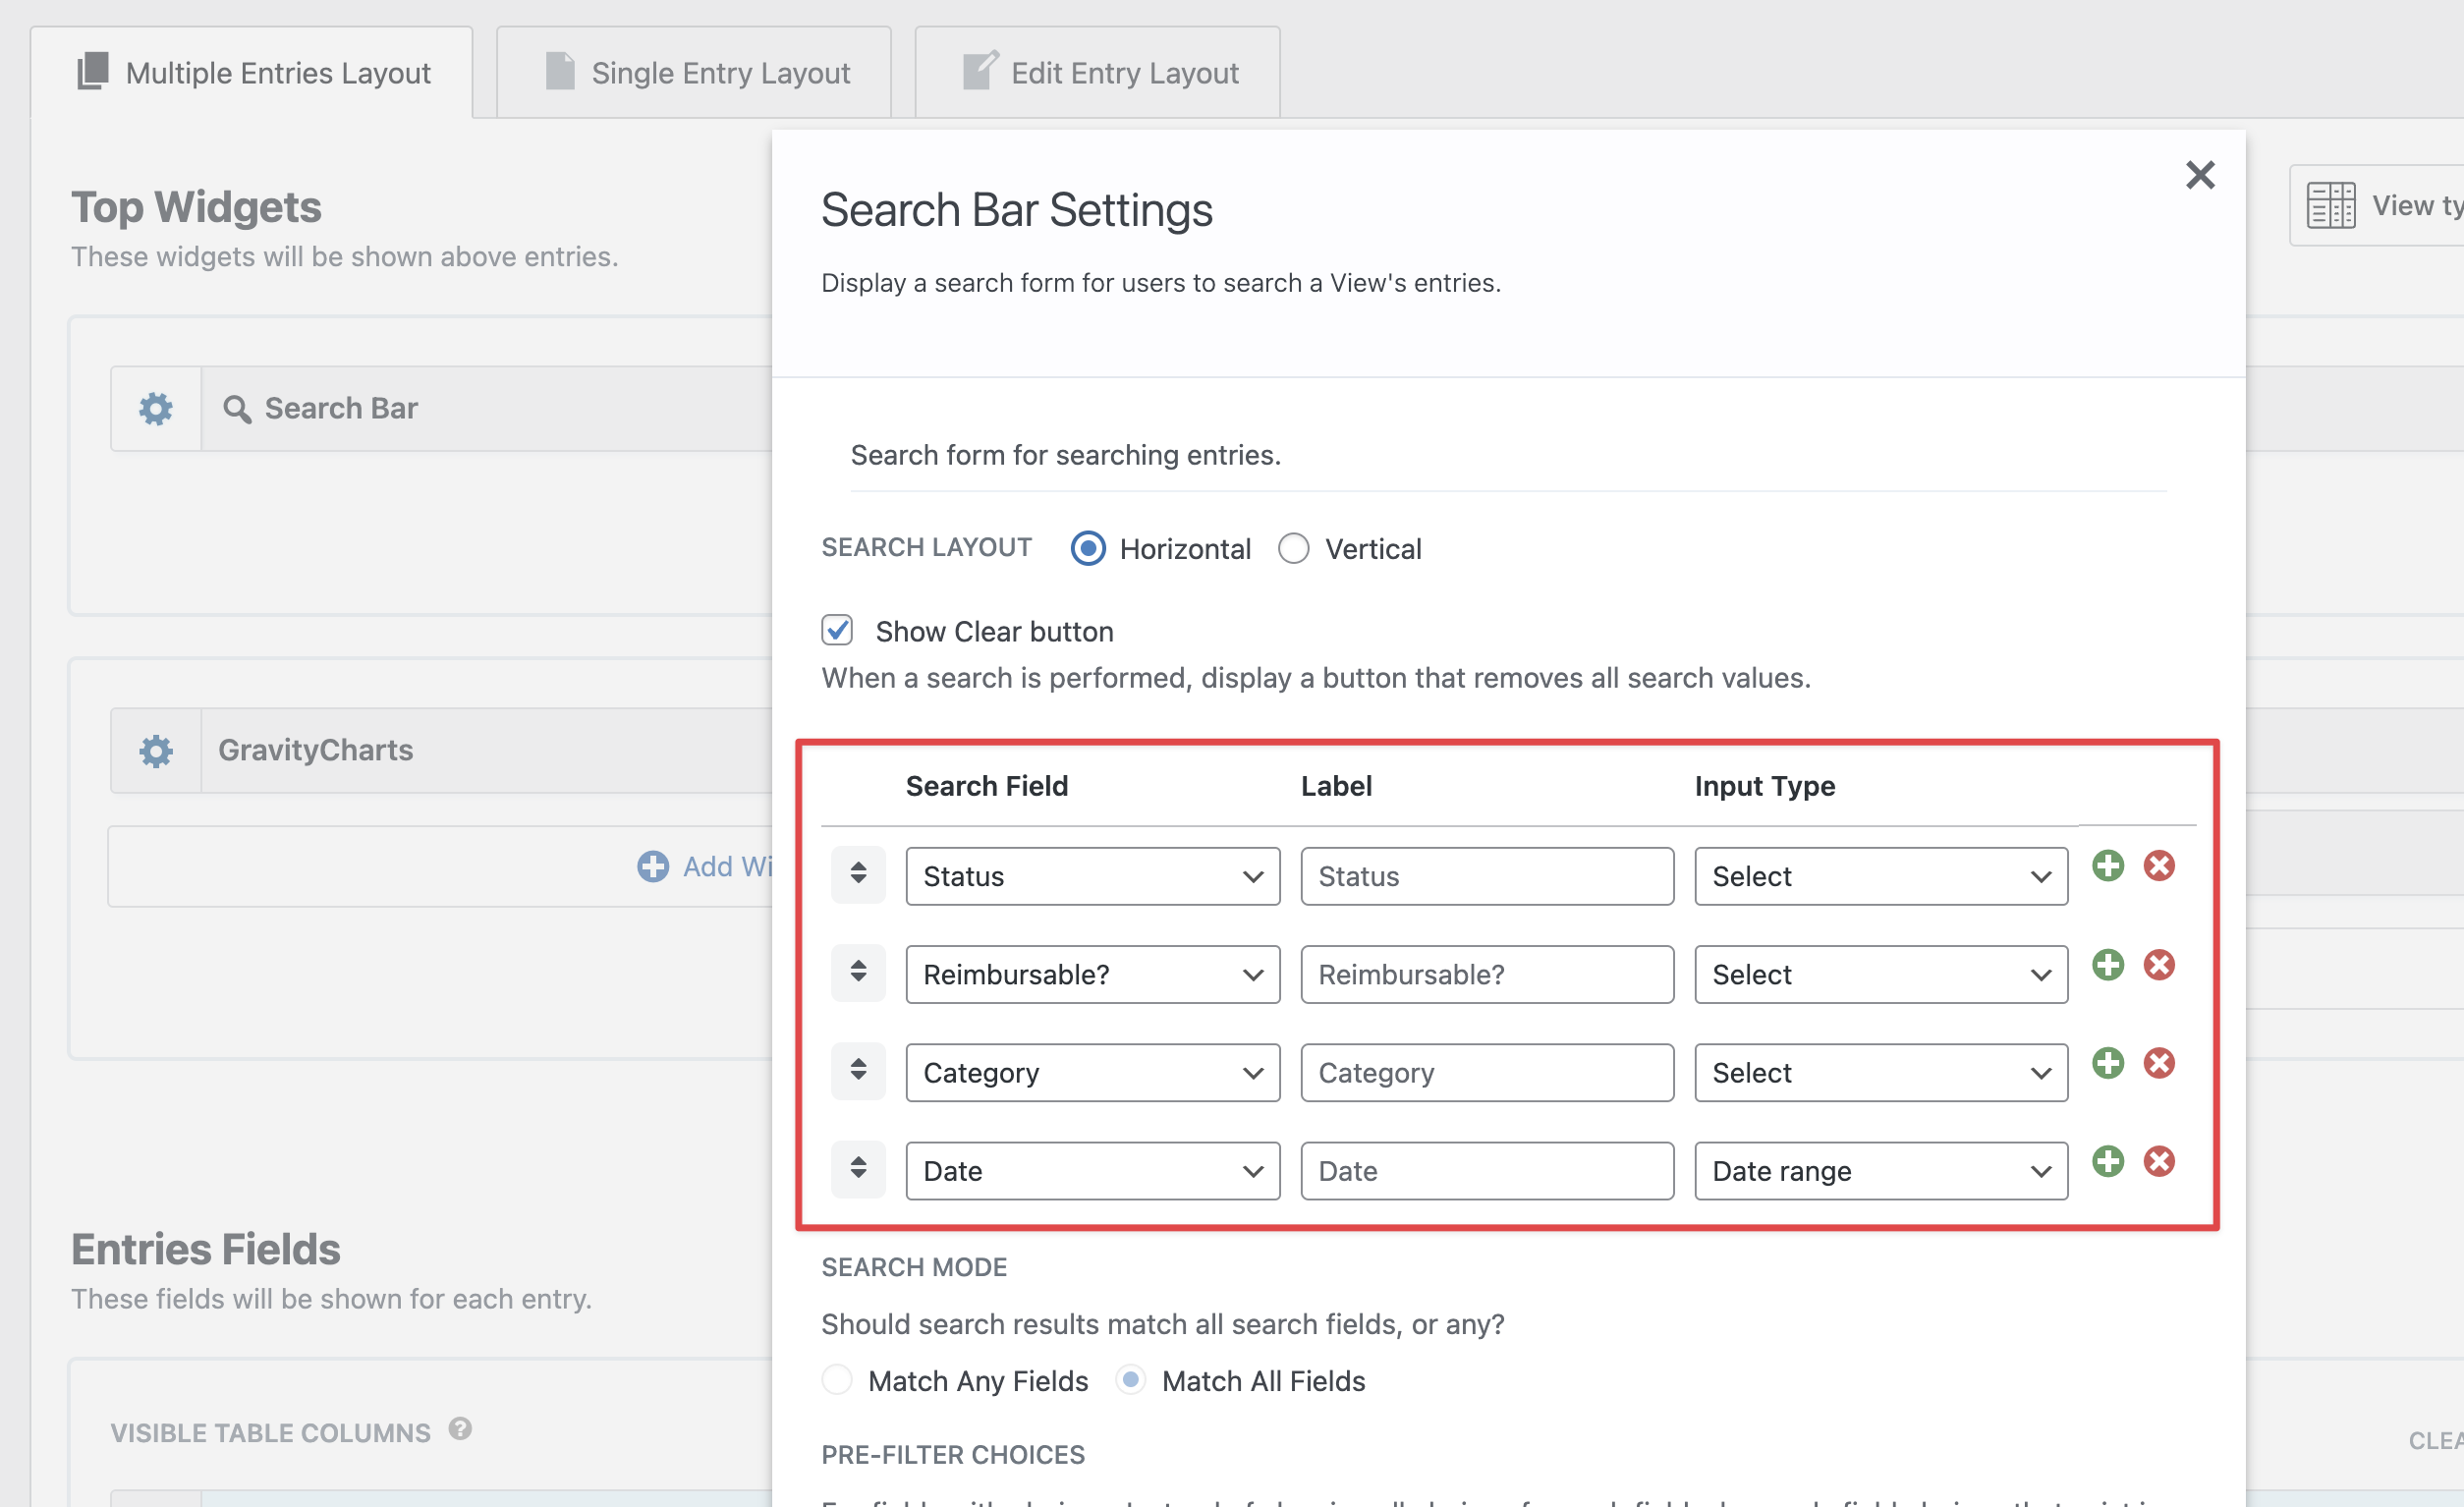
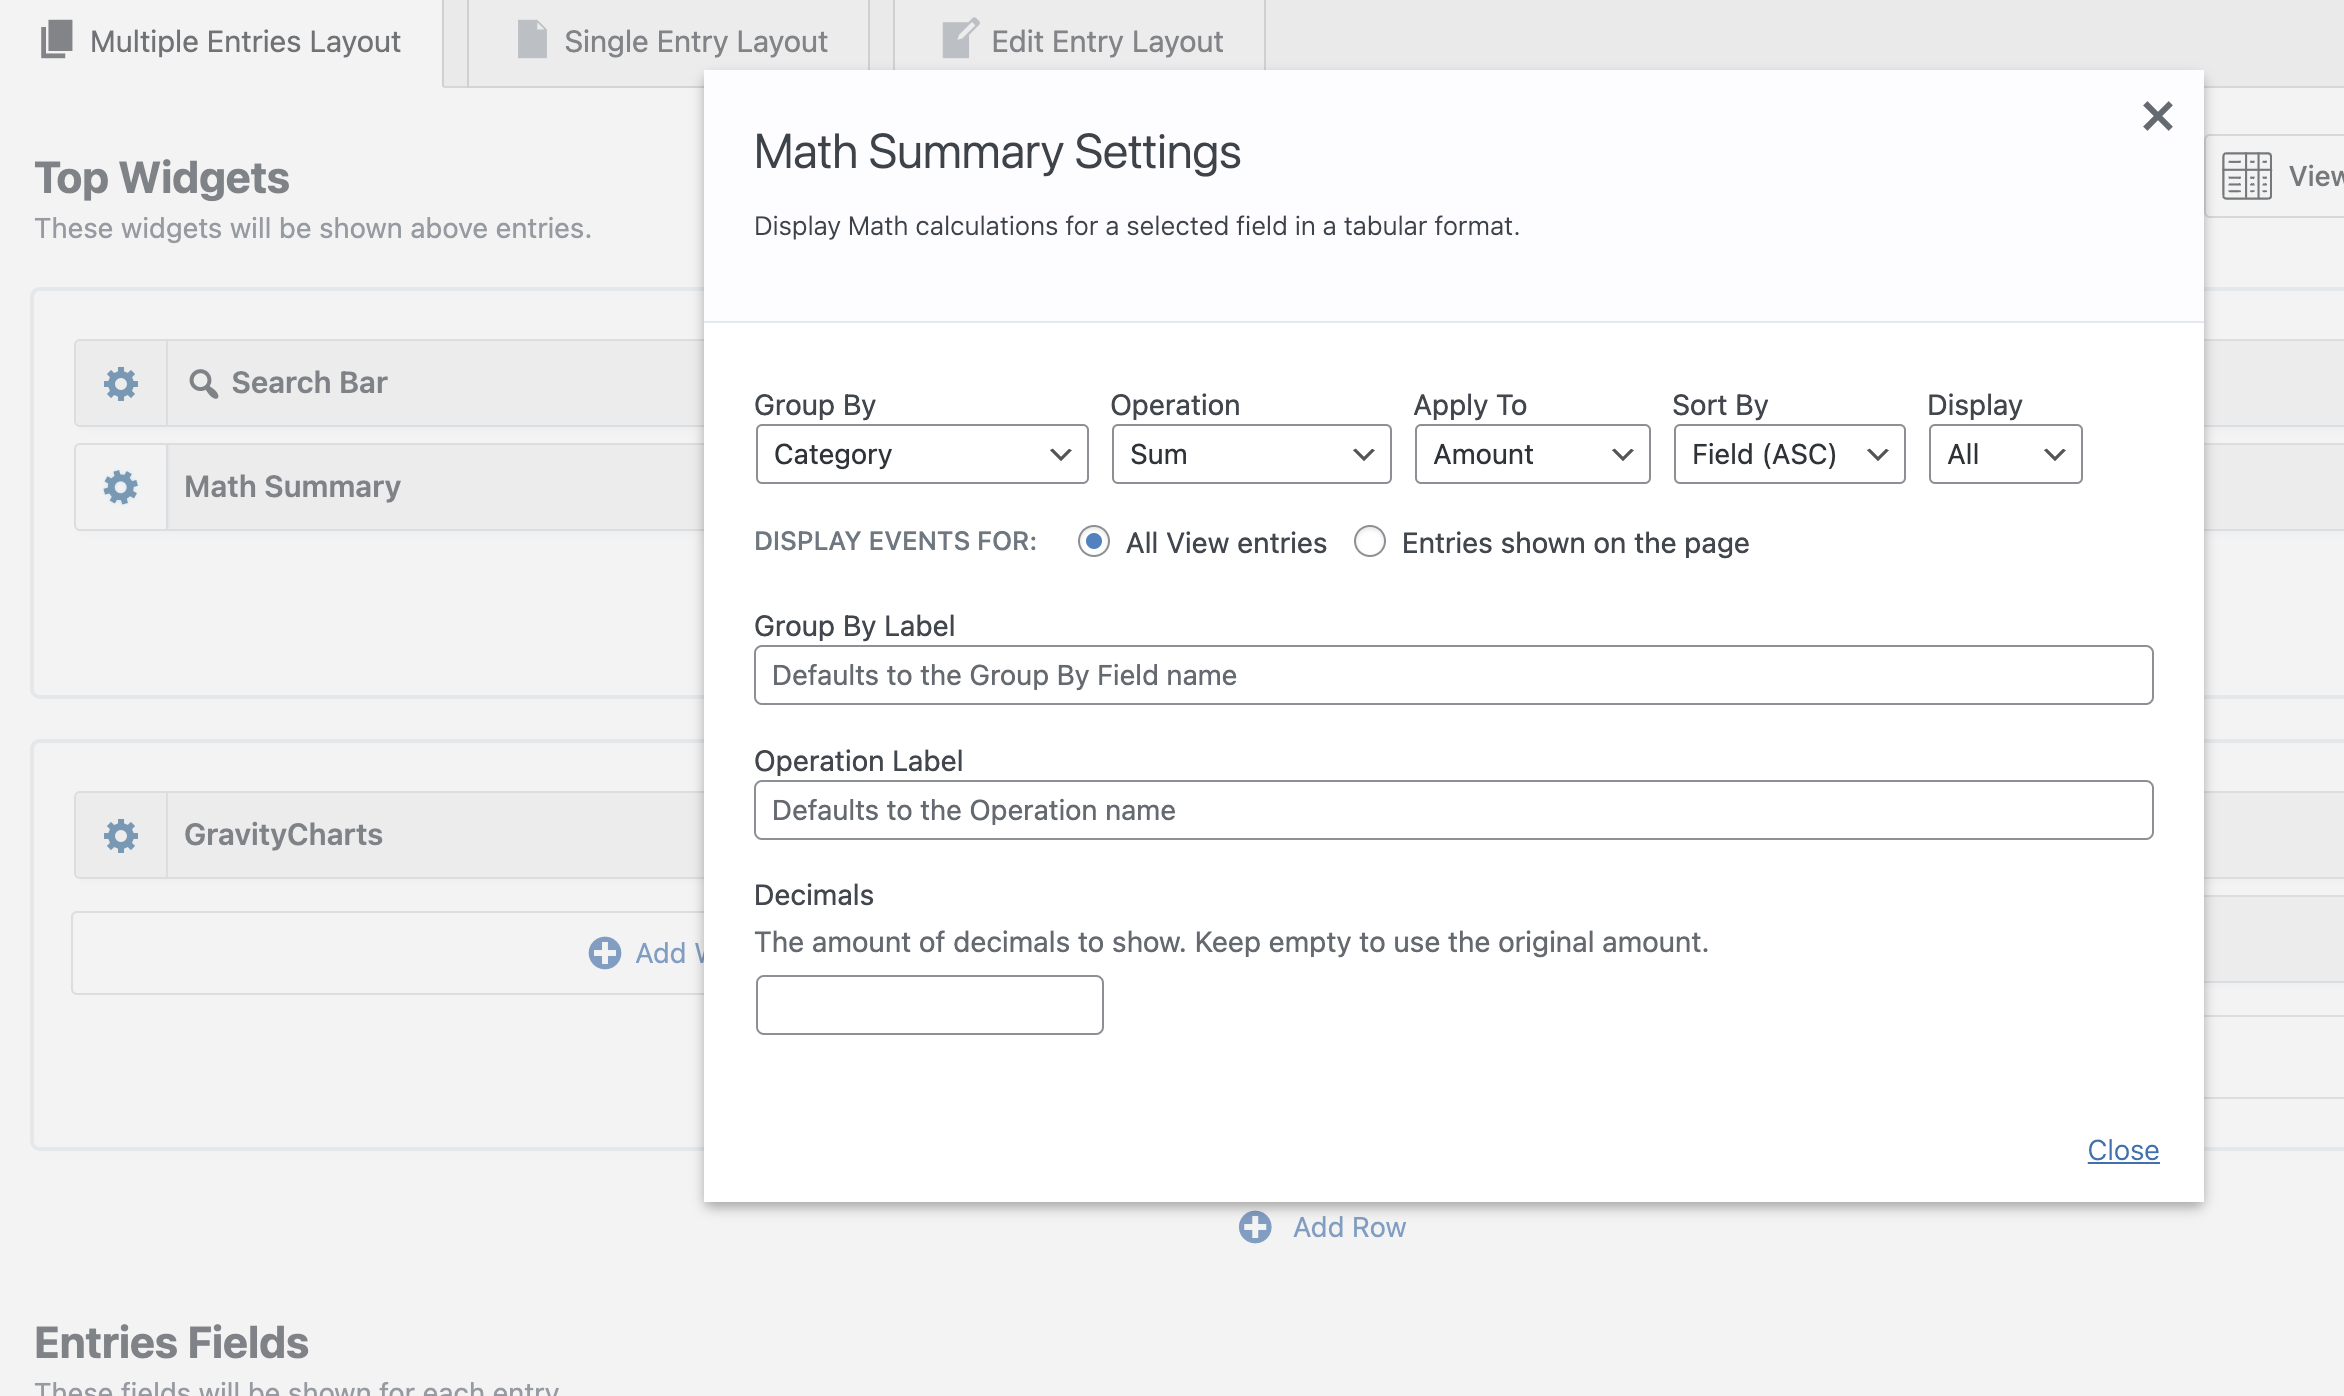
The final step is to create the summary table at the top showing the total amount spent for each category. You can do this using the GravityMath Summary widget.
Here’s what the finished expense tracker looks like on the front end:
![]()
Want to learn more? Check out a live demo of the expense tracker here.
Education (Student Portals)
Educational institutions often have a need to create portals and resource pages for students and staff. In this example, we show you how to build a student portal for assignment submissions and class schedules.
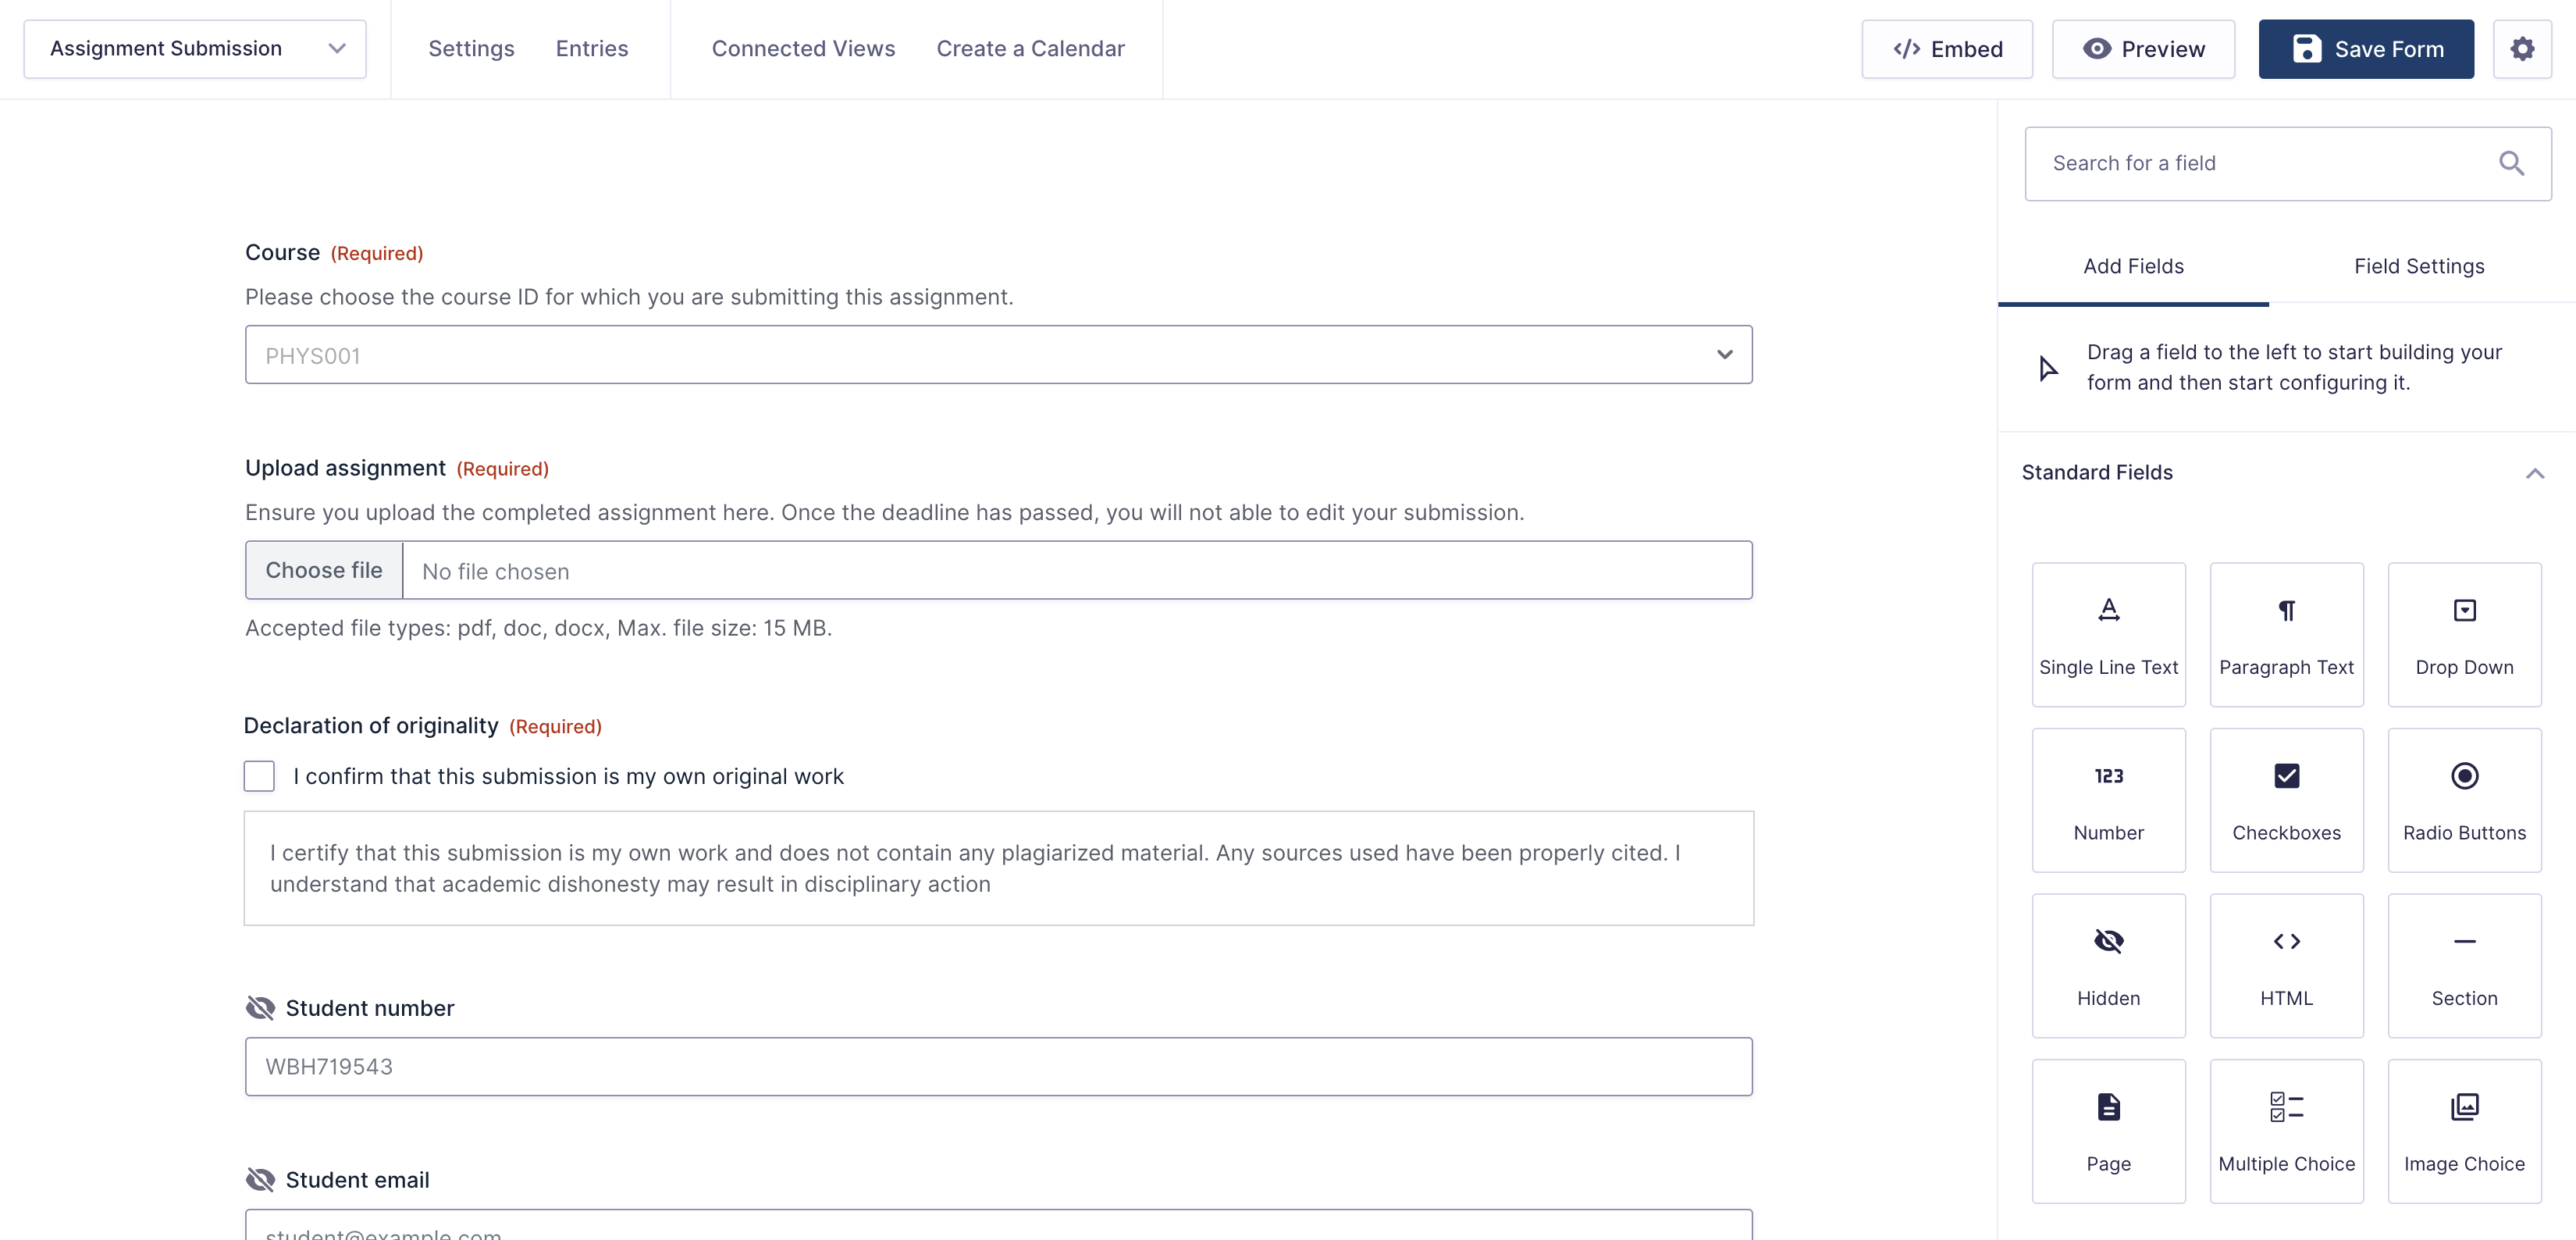
Start by creating a form that students can use to submit their assignments. Make sure to include a File Upload field so students can upload their assignments in various file formats. Finally, include an administrative Number field that professors can use to assign a grade after review.
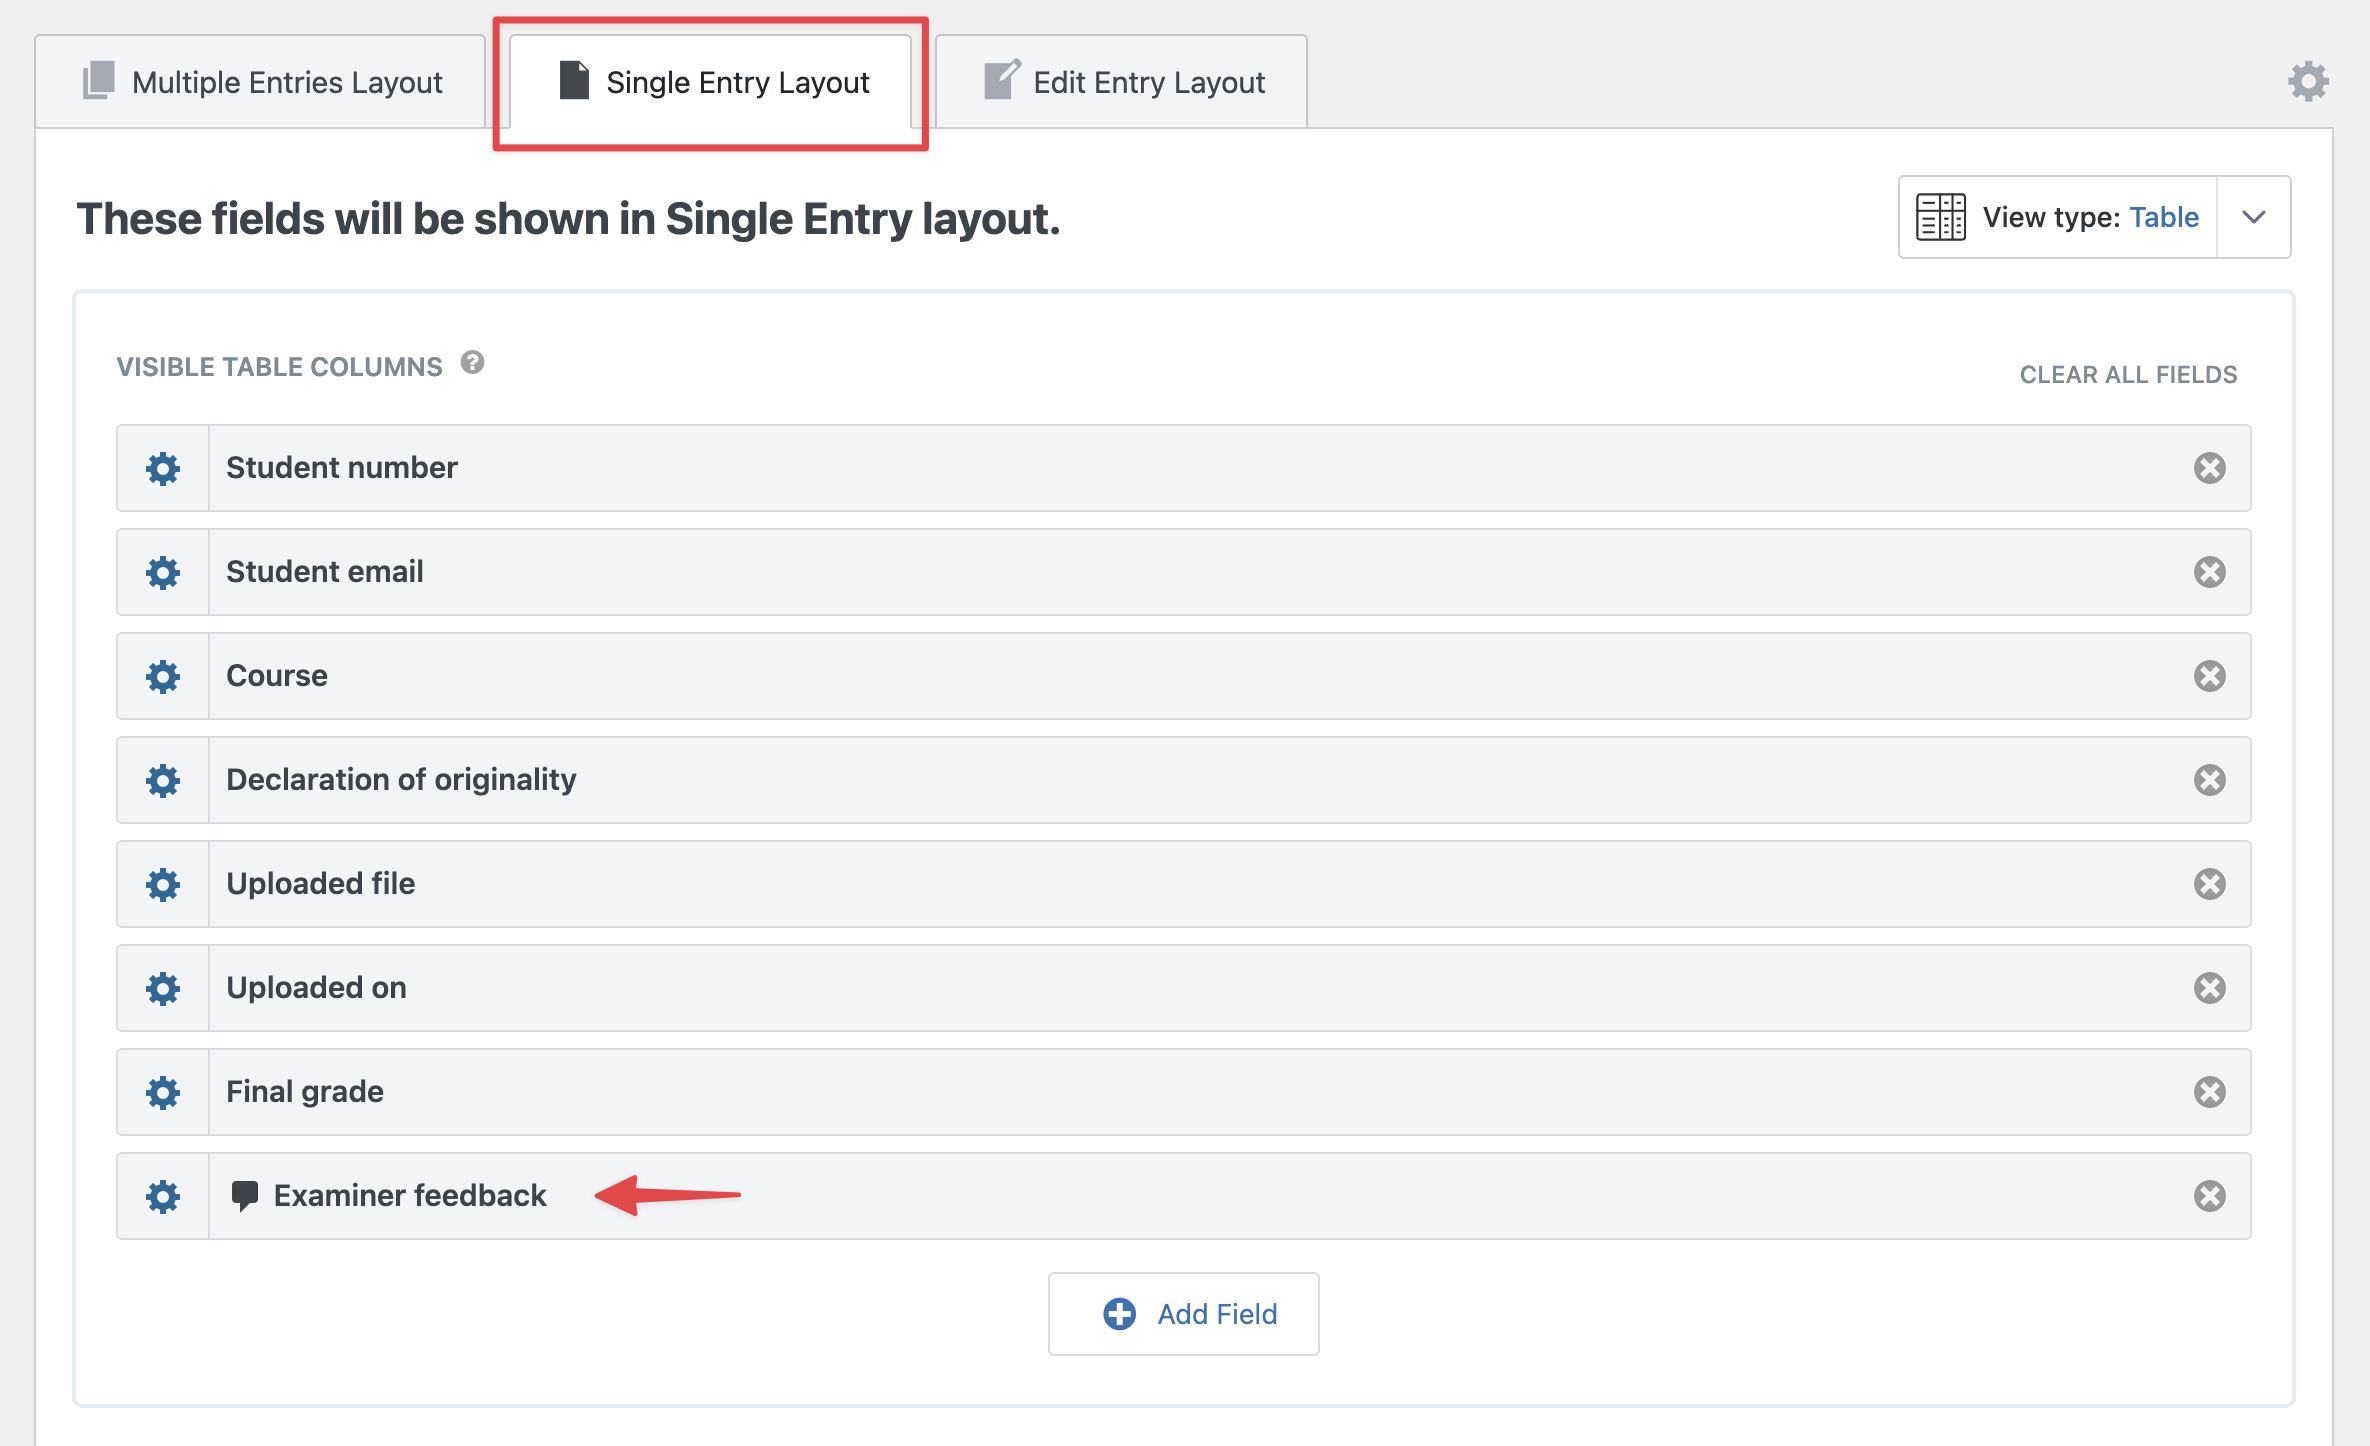
Next, create a table View using GravityViewwhere students can view their submitted assignments, along with the grade that they received.
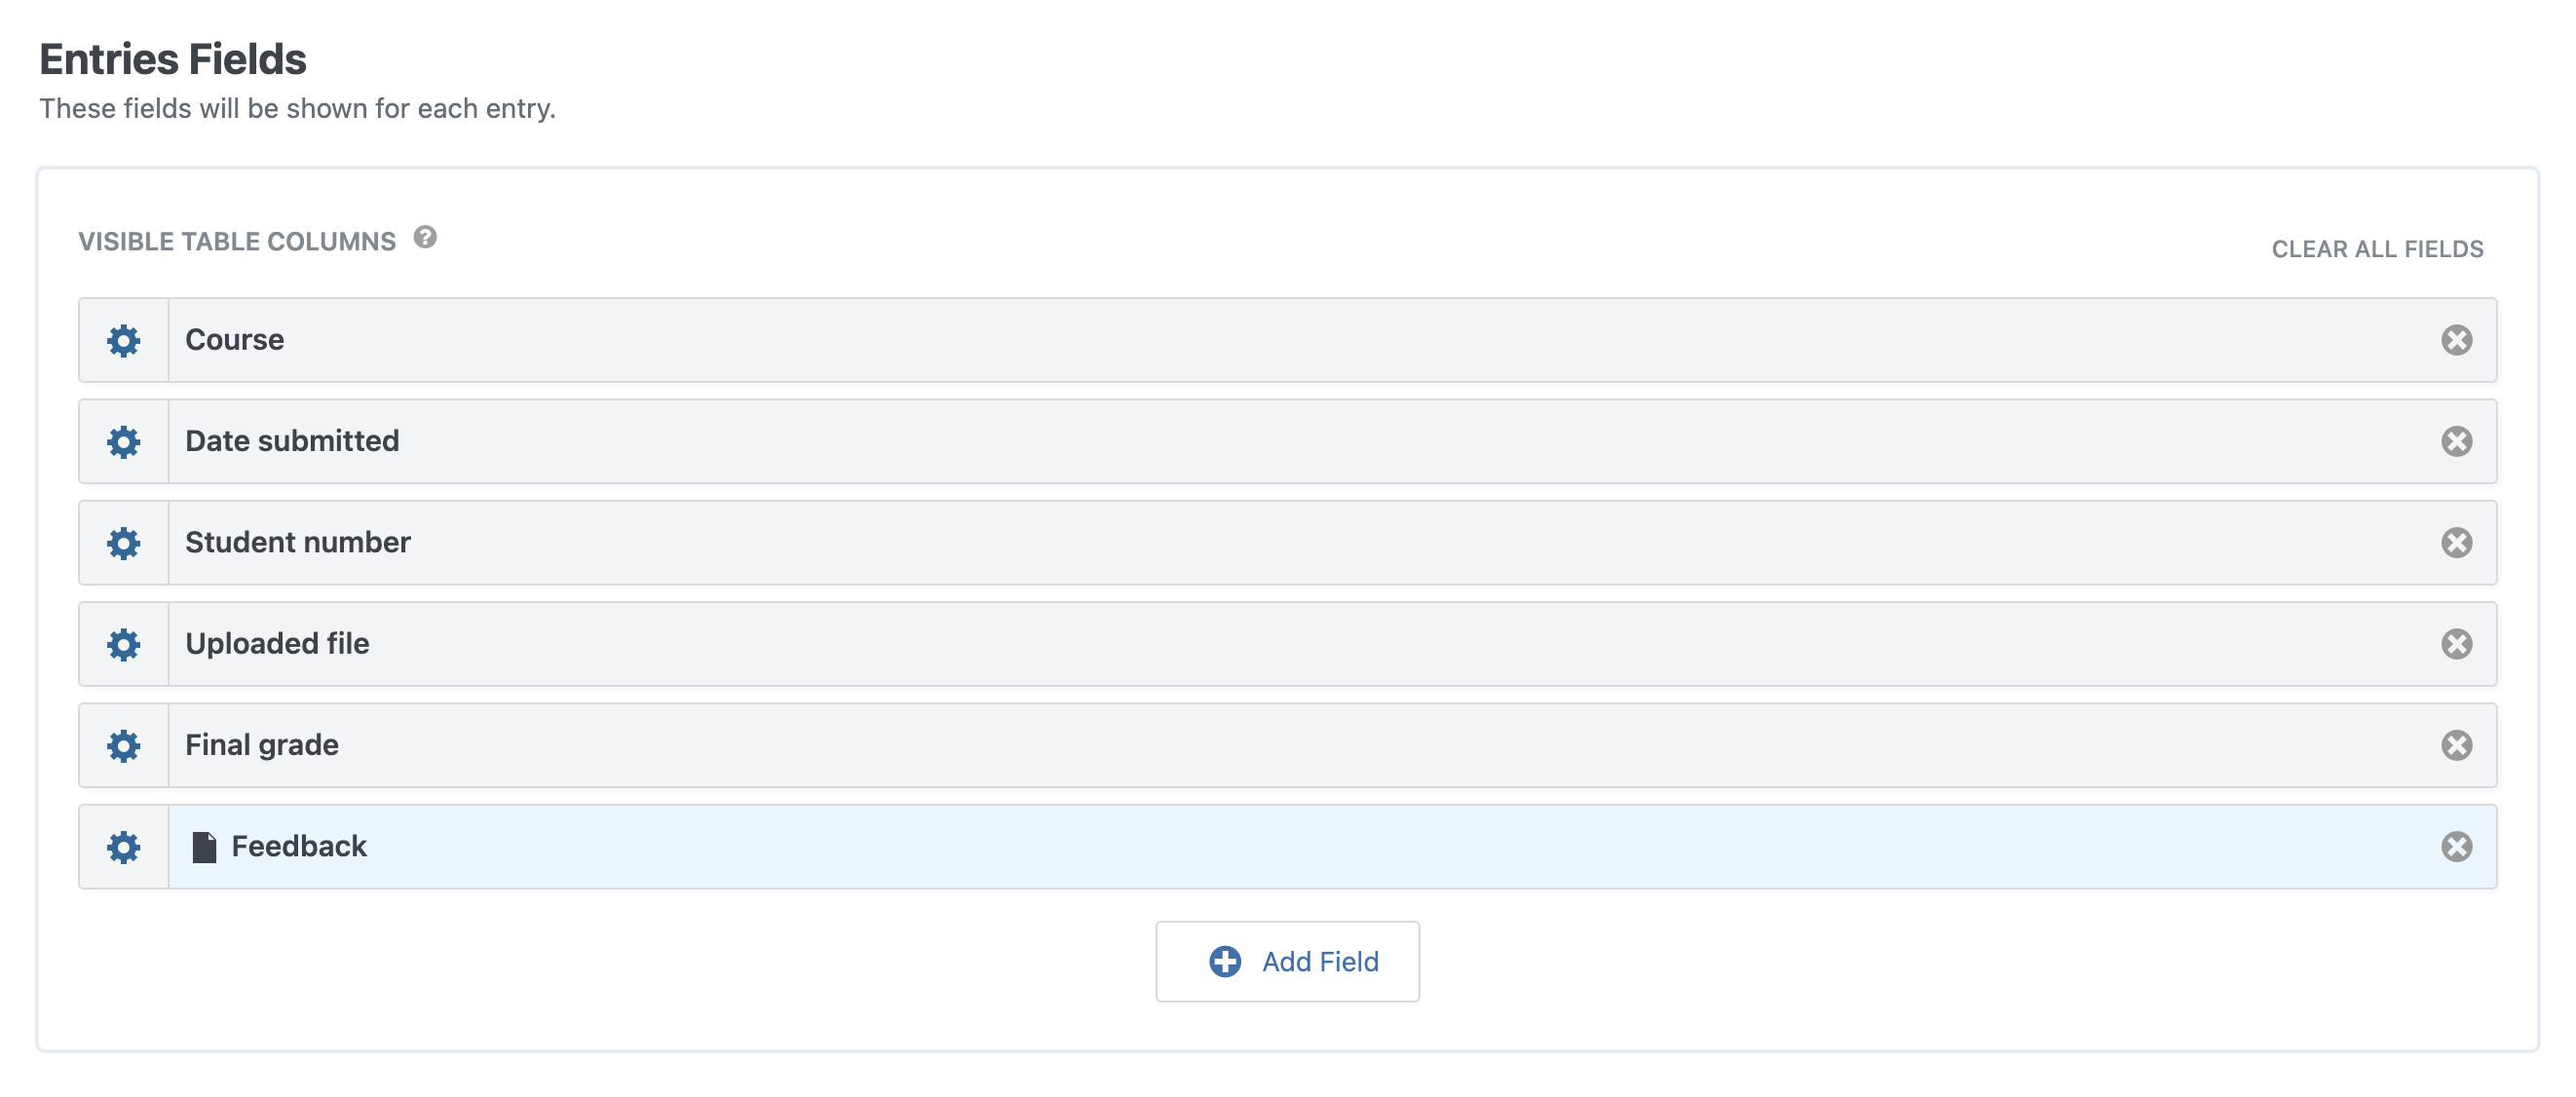
With GravityView, you can also configure a Single Entry page where users can view more information about a specific entry. Here, we’ll add the Entry Notes field to display feedback from professors.
In Gravity Forms, Entry Notes enable users to leave comments on specific form entries. With GravityView, these notes can be viewed and added directly from the front end.
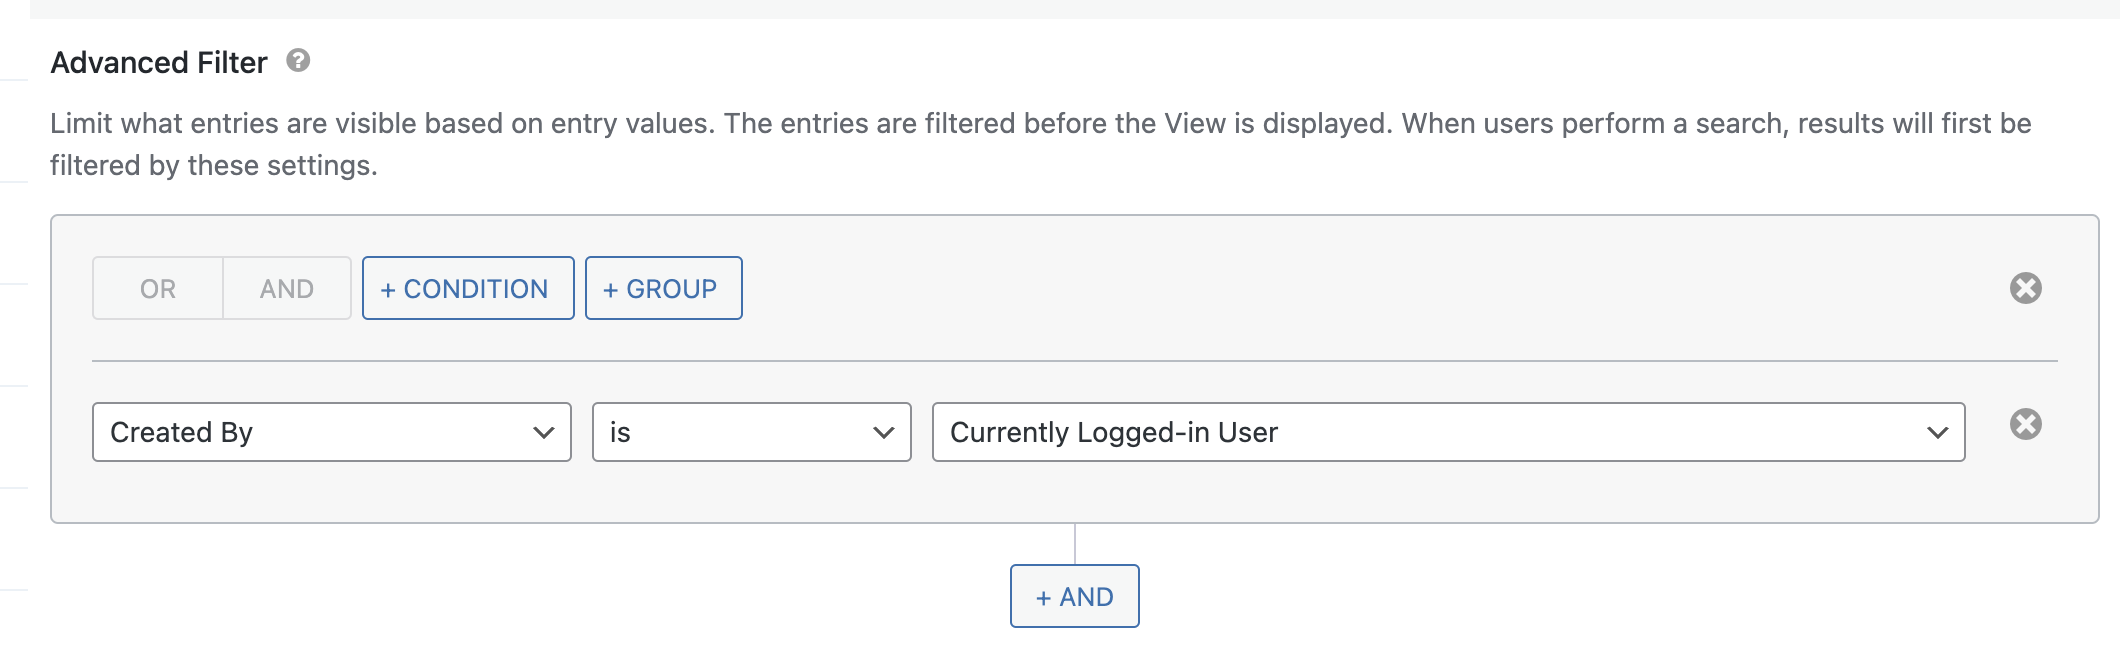
To ensure students are only able to see their own assignments, and not other students’ assignments, add an advanced filtering condition to restrict entries to those created by the currently logged-in user.
The final step is to configure the remaining elements of the dashboard. What you add here will depend on the information you want to show to students. For example, you could use GravityCalendar to display class schedules or upcoming courses and events.
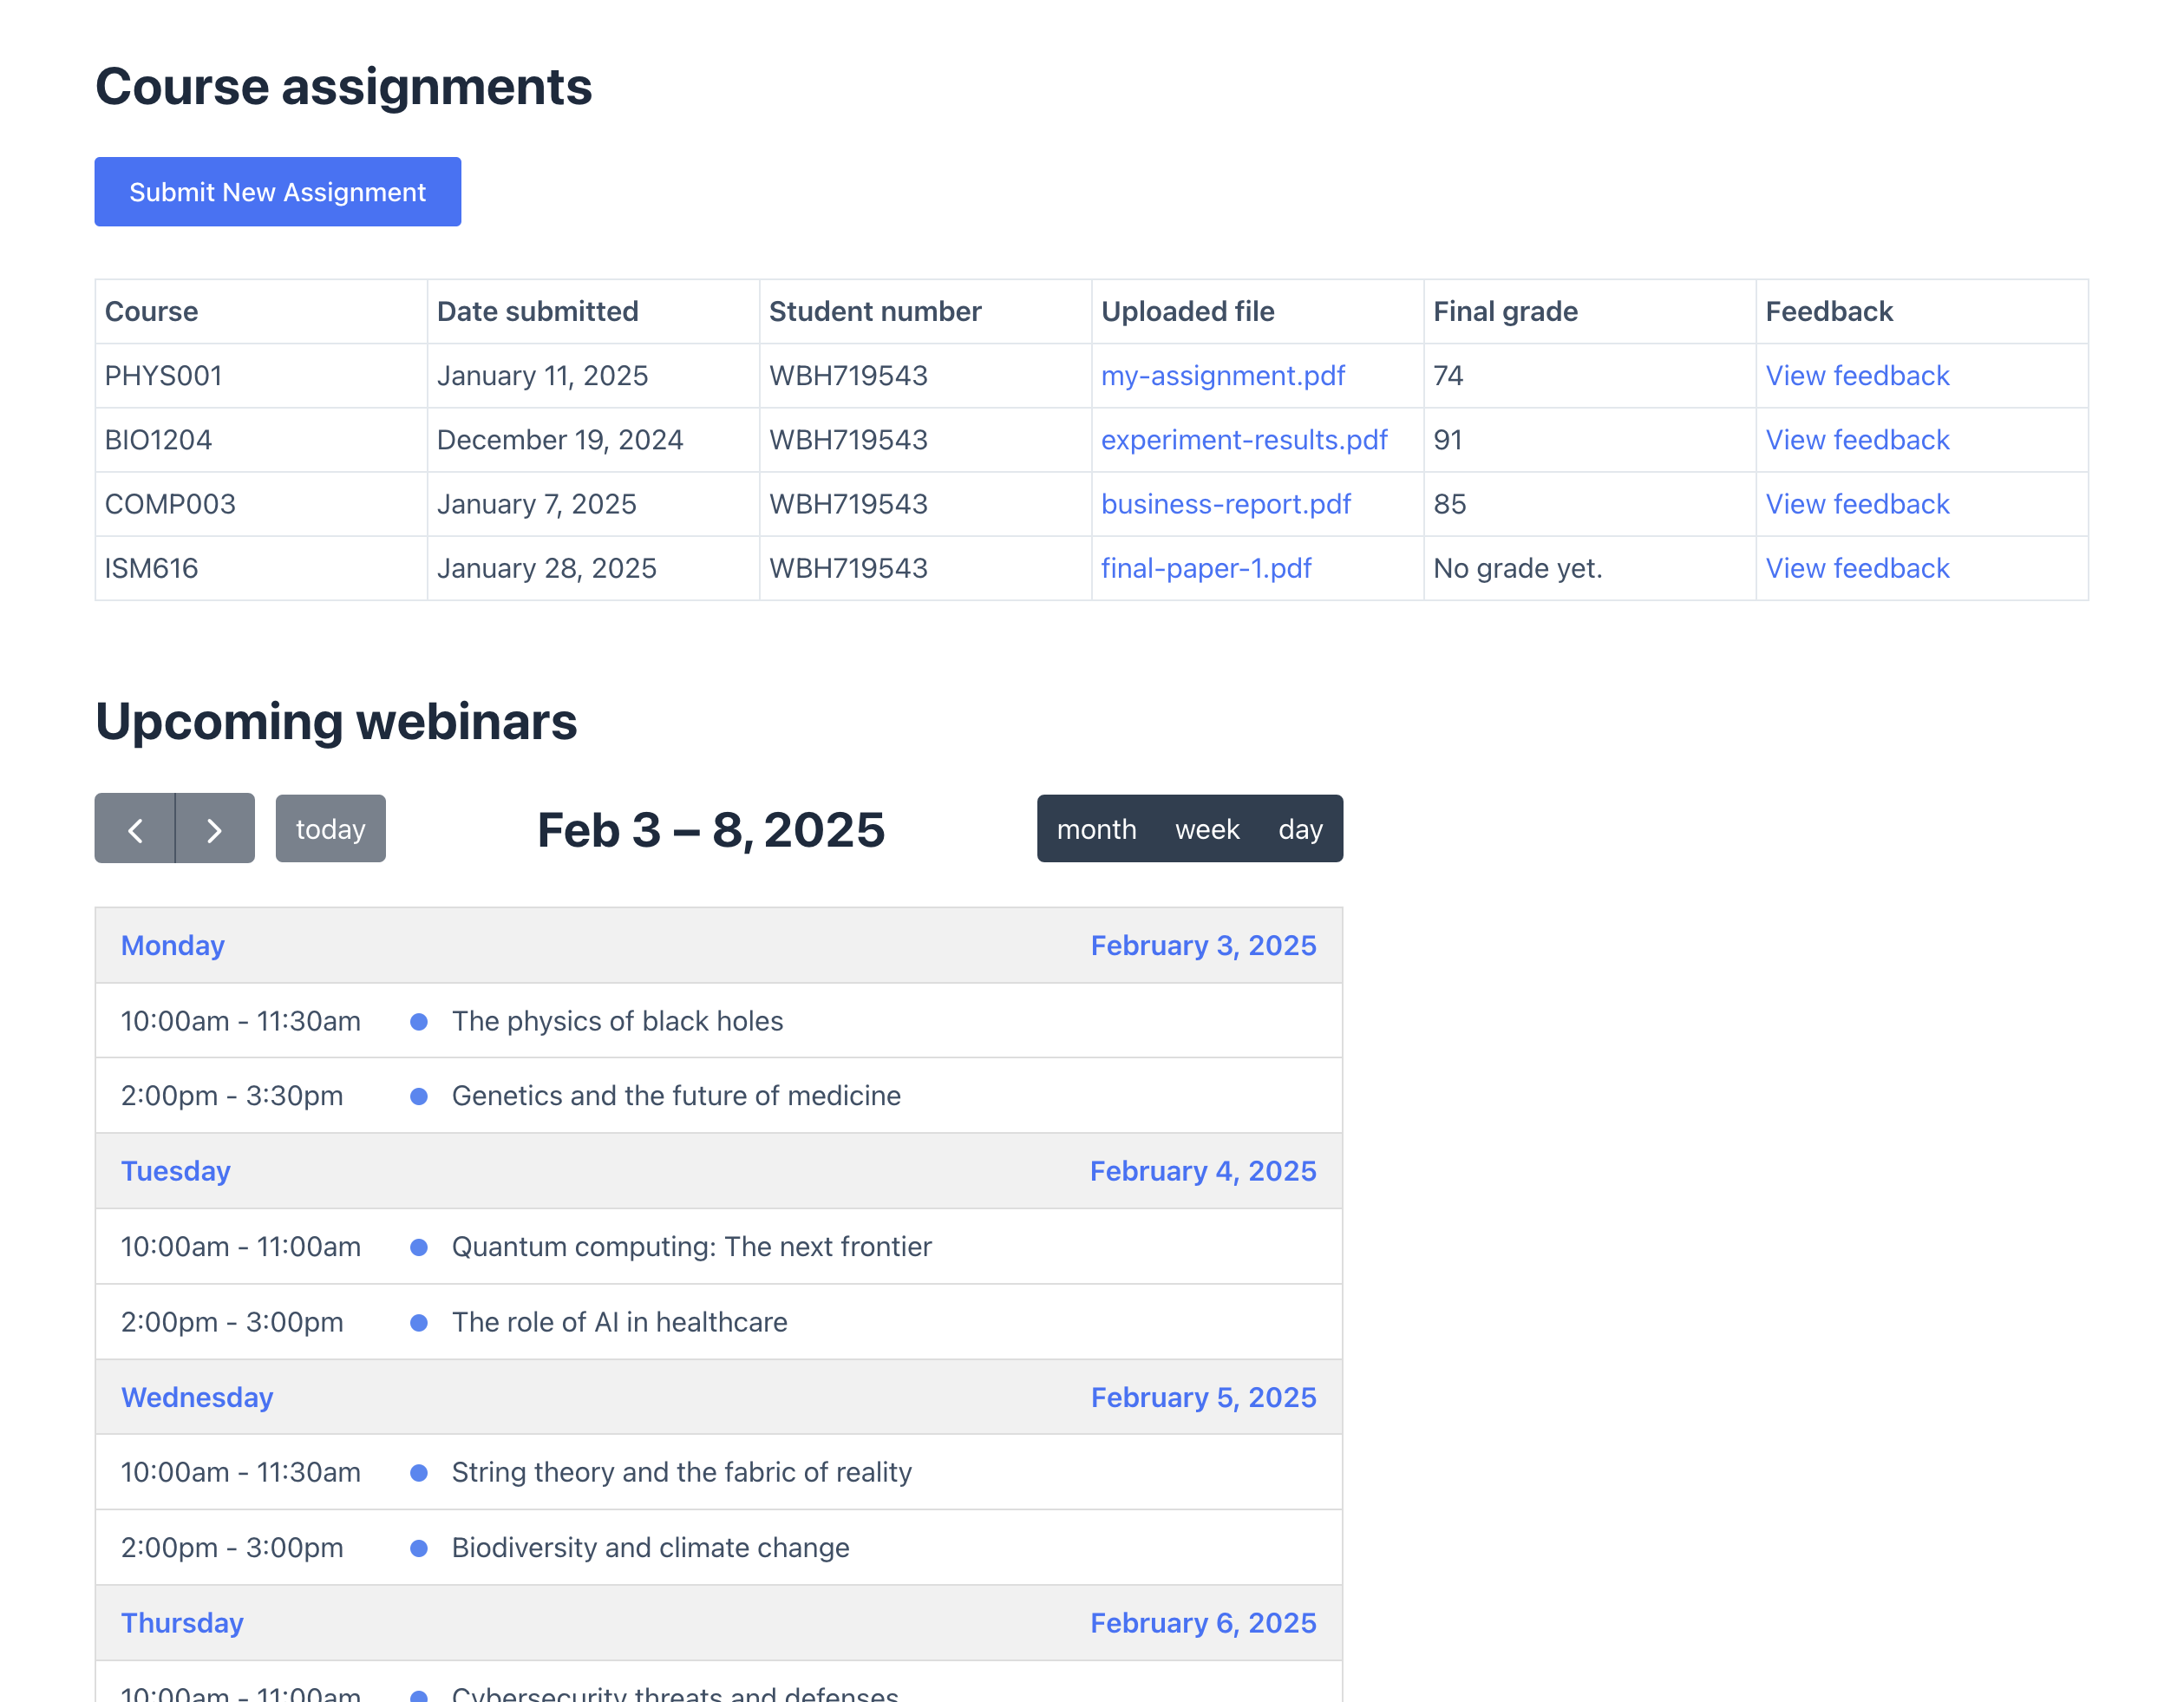
Here’s what the finished student portal looks like on the front end:
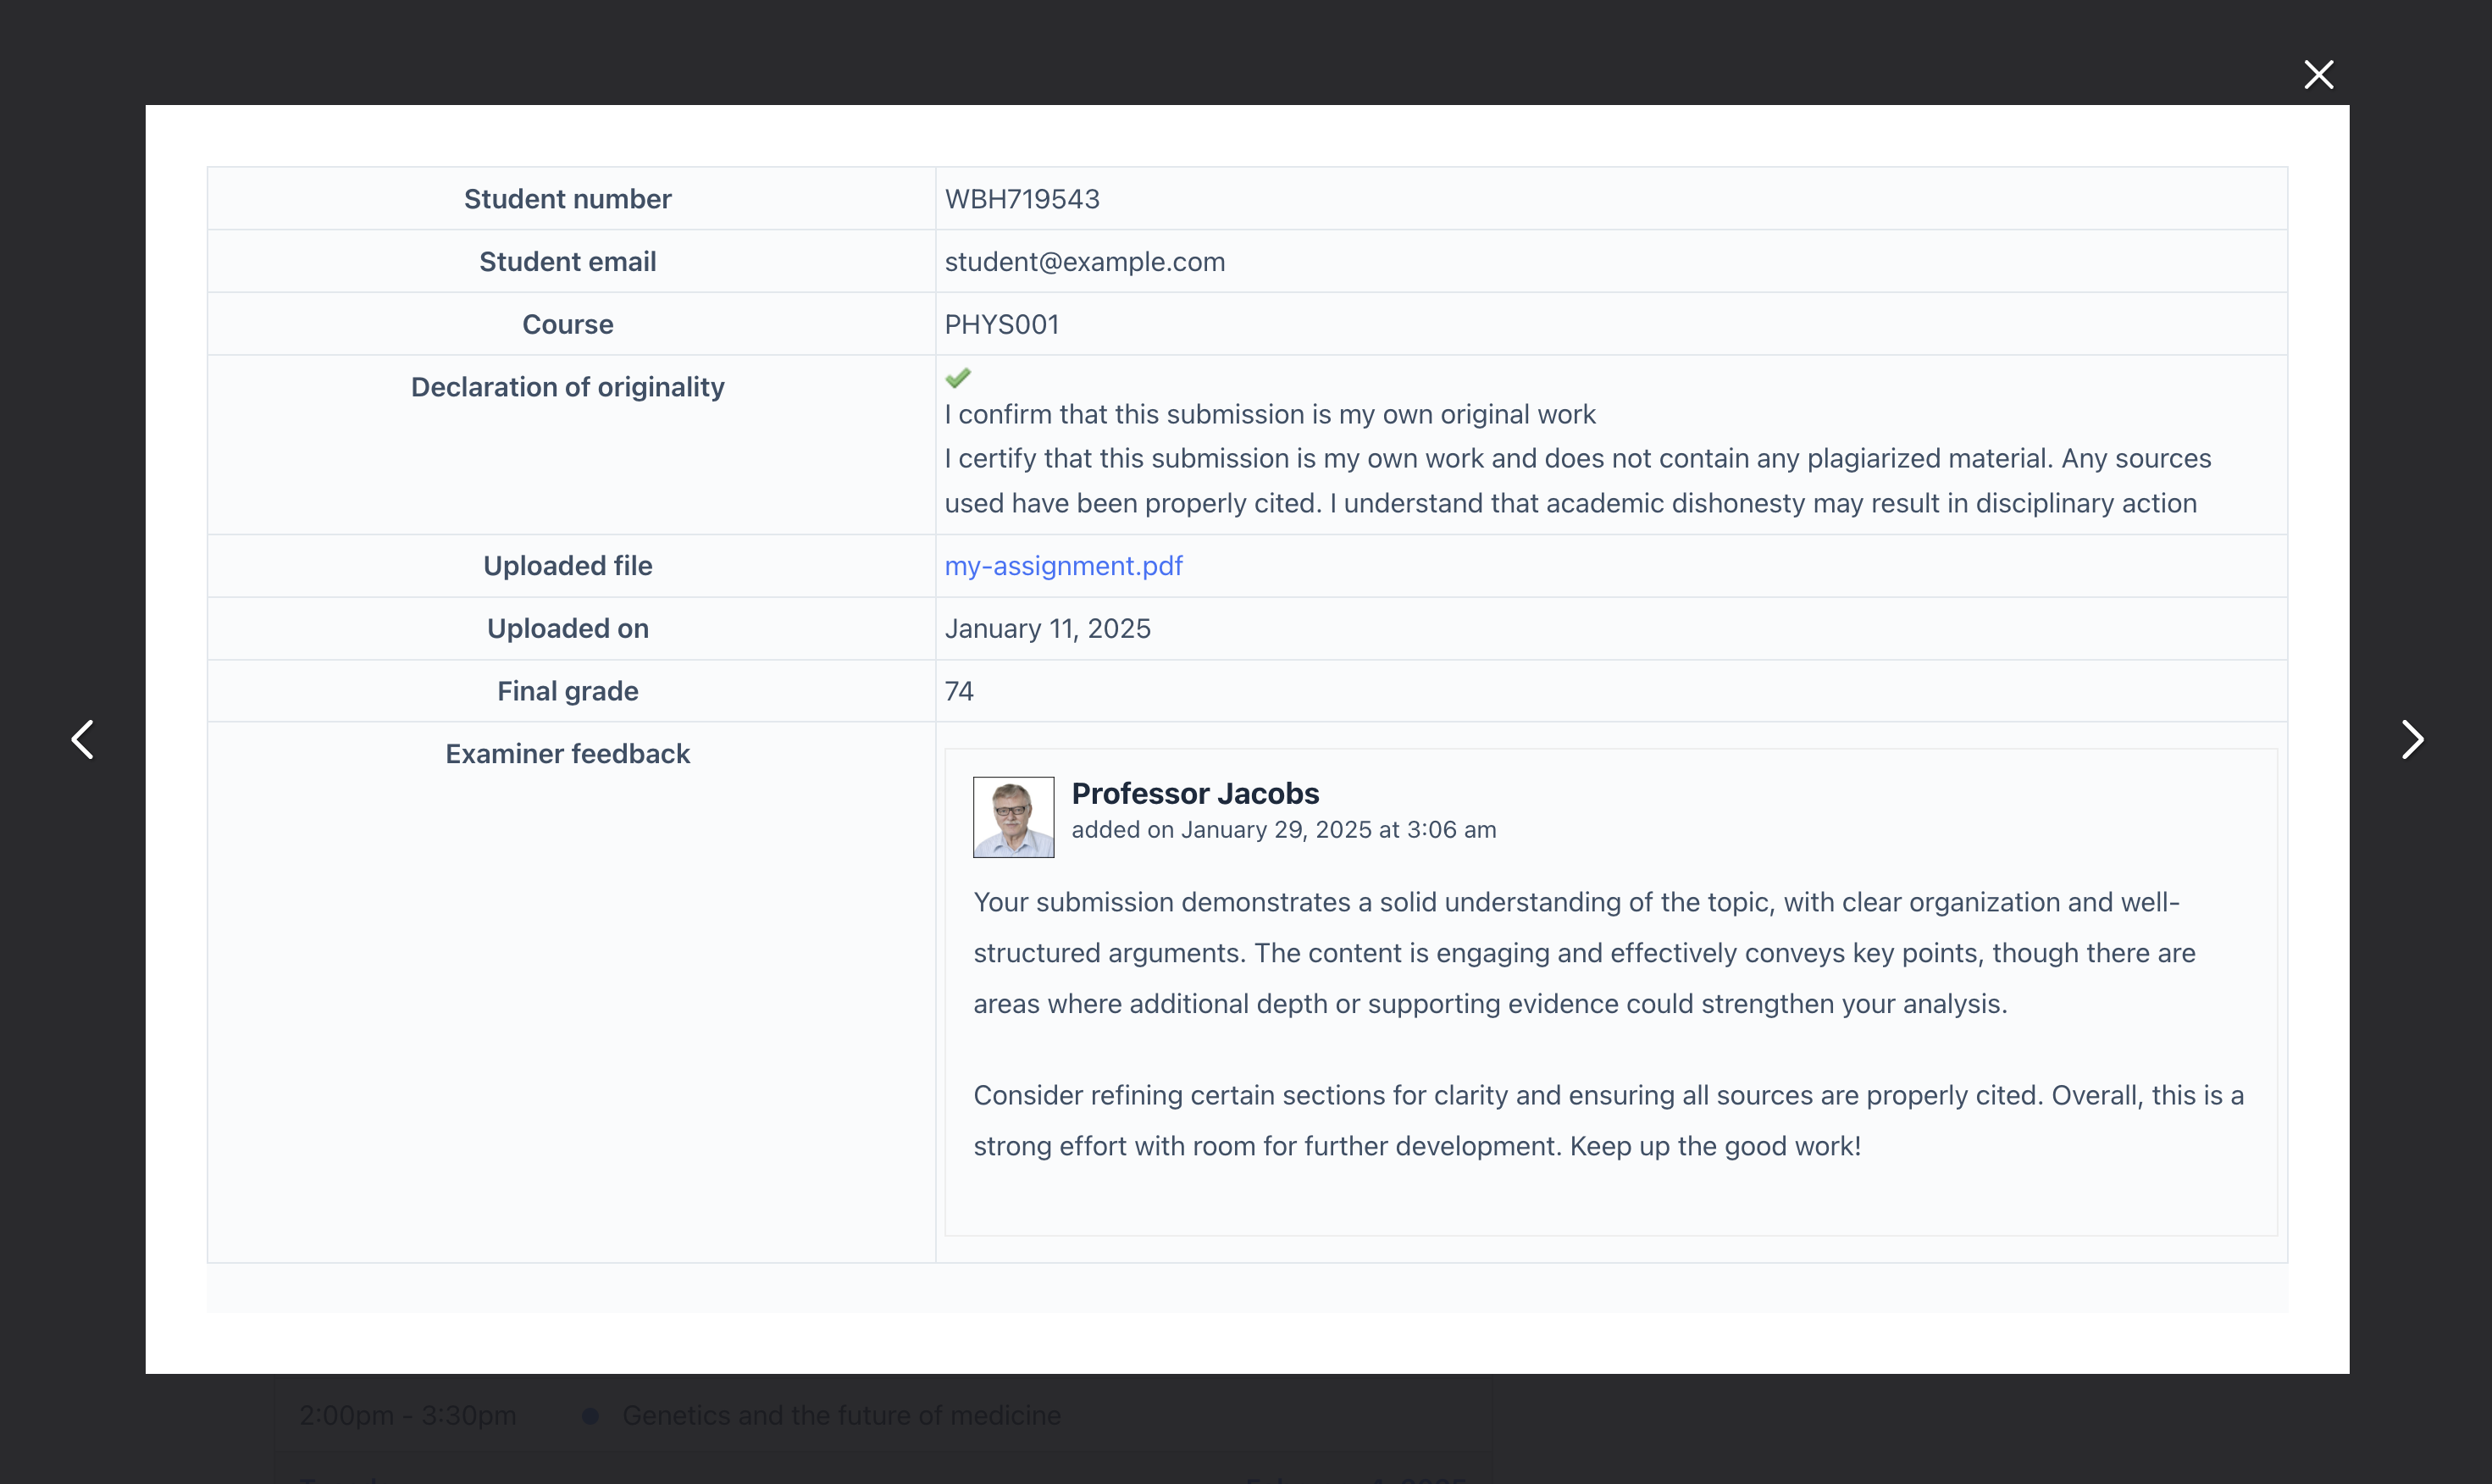
Clicking View feedbackopens a modal to the Single Entry layout, where students can see more details about their submission, together with feedback from their course professor.
To see how it works, you can check out a live demo of the student portal here.
Fitness (Workout Tracker)
The final example is a workout log and fitness tracker that you can use to measure your progress over time and track your workouts.
Start by creating a form for logging your workouts. You can use list fields for logging exercises, sets and reps! Include a separate field for measuring your progress over time. So, if your goal is to lose weight, add a field for logging your weight.
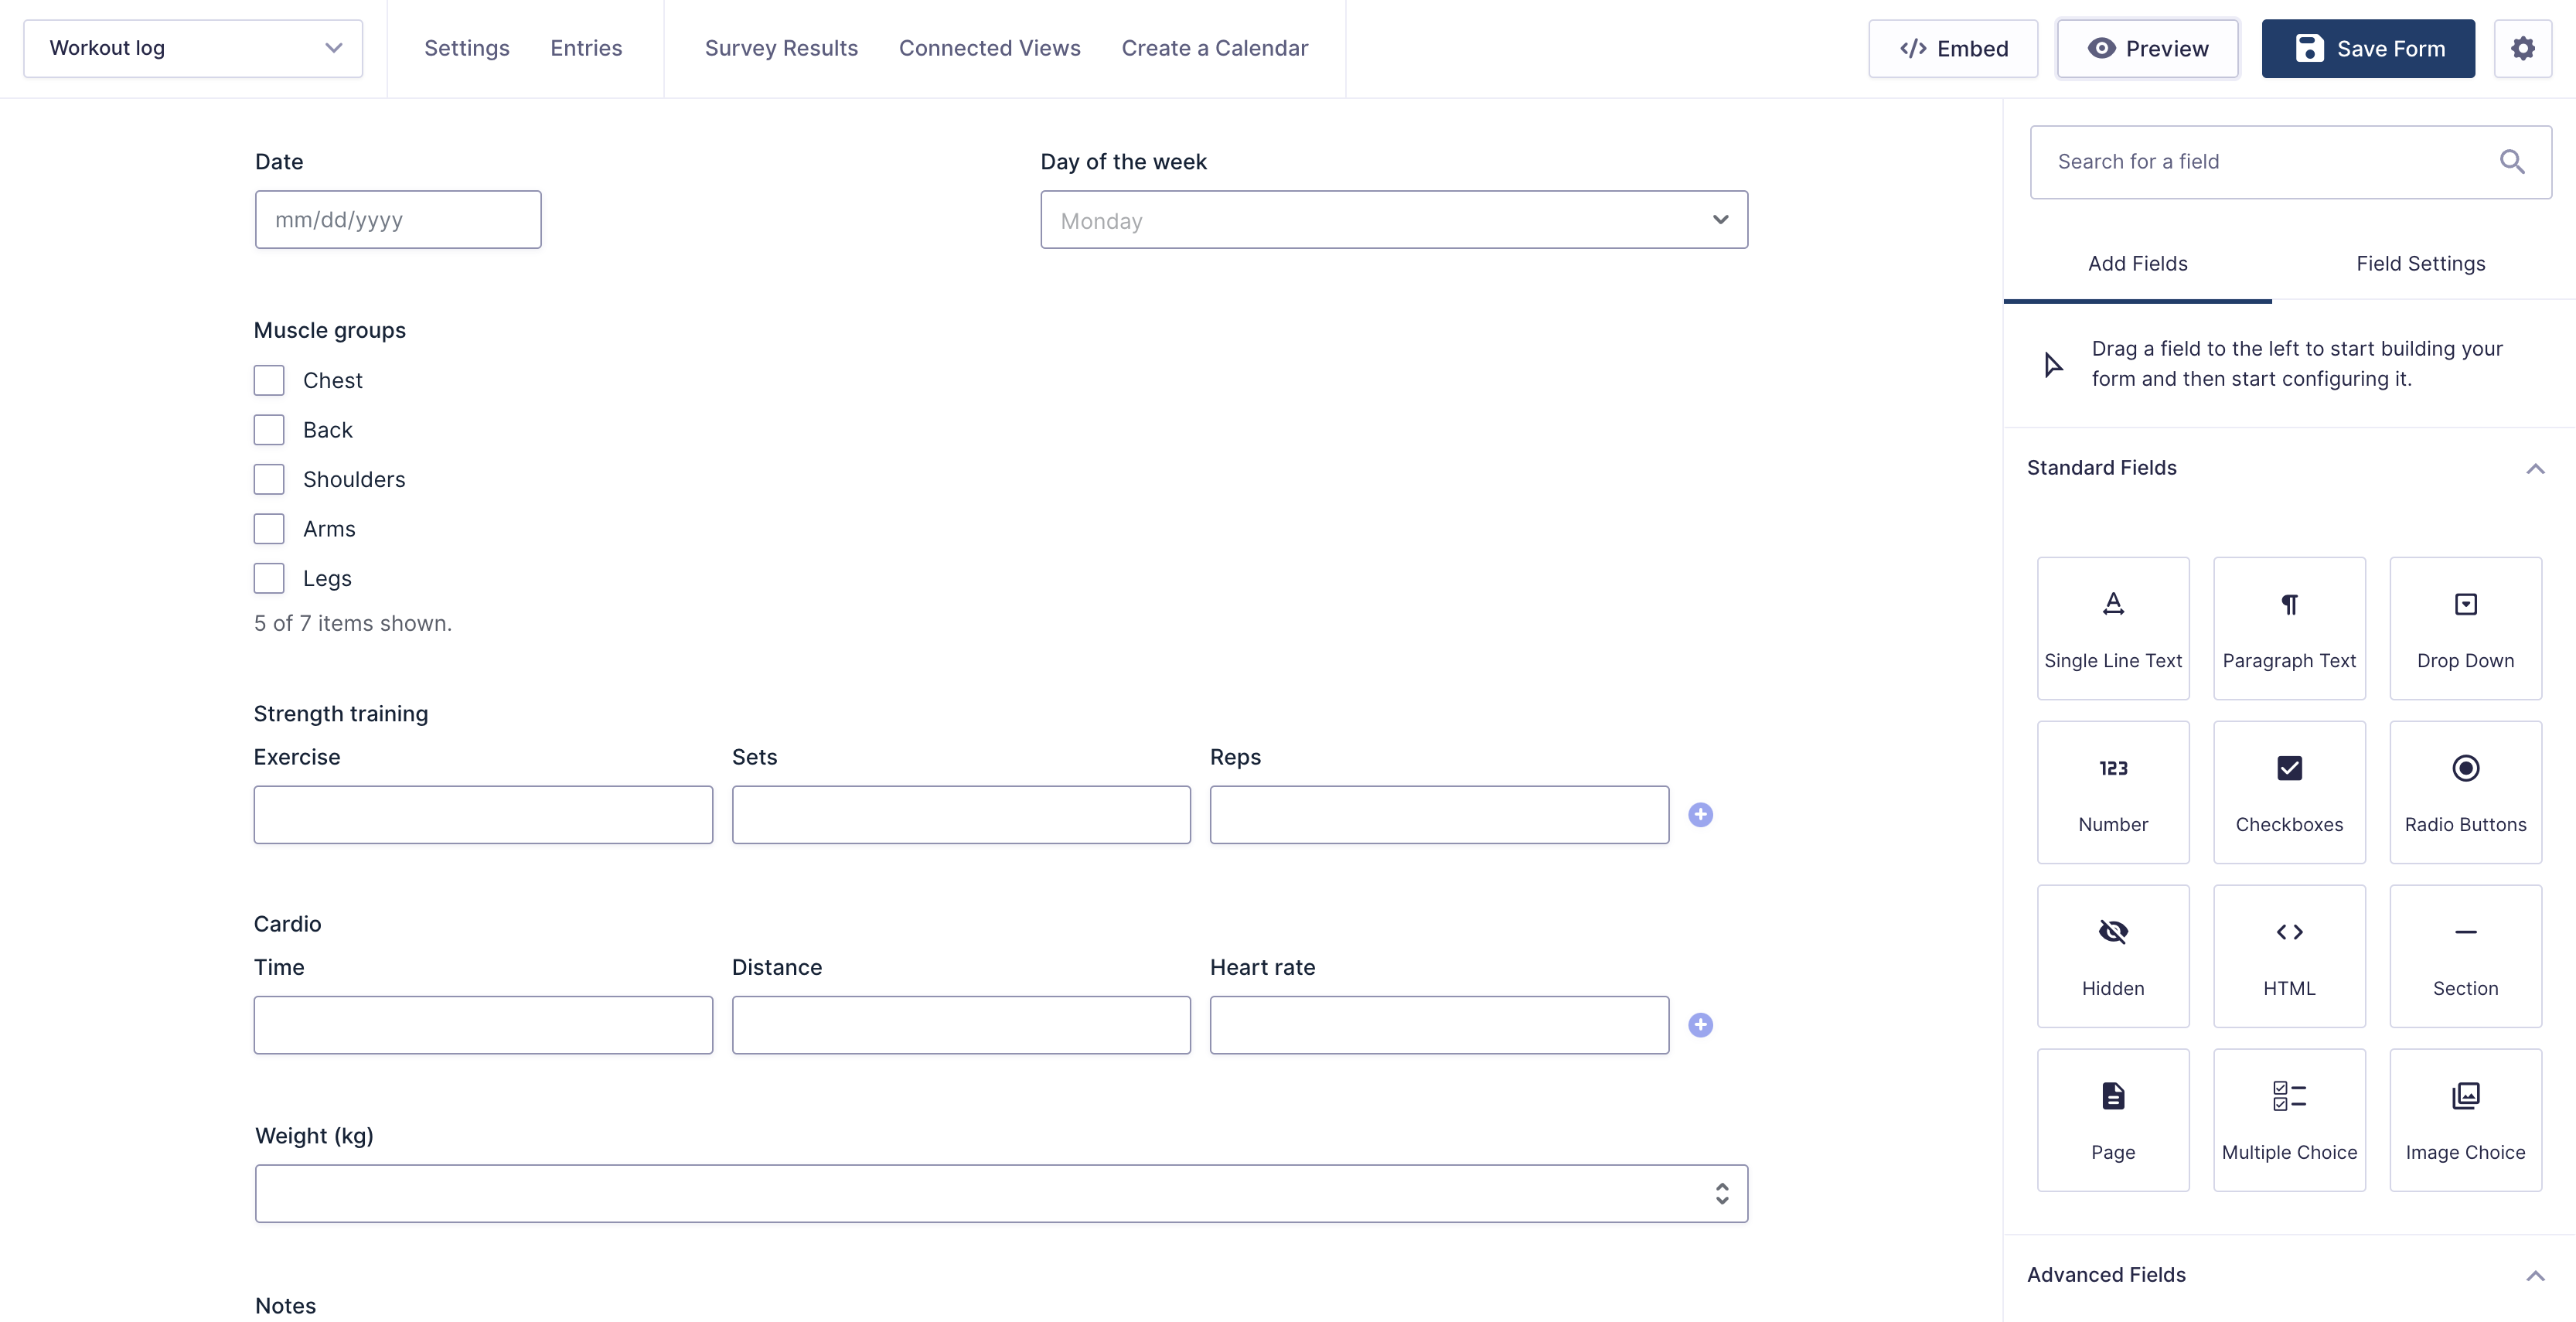
The next step is to create a View using GravityView to visualize your workout journal and a chart with GravityCharts to see your weight loss progress over time.
![]()
You can check out a live demo of the fitness tracker here.
Build Your Dashboard Today
Whether you’re running a nonprofit, managing a business, educating students, or tracking personal goals, your form data holds valuable insights – if you know how to unlock them.
With Gravity Forms and GravityKit, you can build real-time data dashboards without code. From dynamic tables and visual charts to live filters and custom calculations, GravityKit gives you everything you need to build tailored reporting solutions for Gravity Forms.